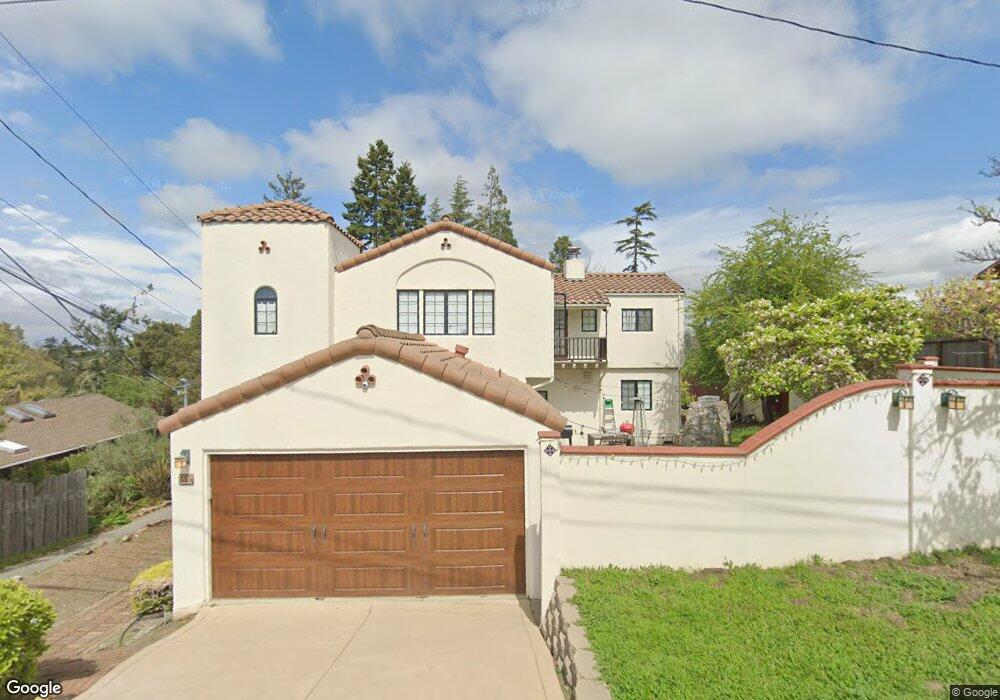
555 Vistamont Ave Berkeley, CA 94708
Berkeley Hills NeighborhoodEstimated Value: $1,858,000 - $2,163,000
5
Beds
3
Baths
2,481
Sq Ft
$792/Sq Ft
Est. Value
About This Home
This home is located at 555 Vistamont Ave, Berkeley, CA 94708 and is currently estimated at $1,964,757, approximately $791 per square foot. 555 Vistamont Ave is a home located in Alameda County with nearby schools including Thousand Oaks Elementary School, Berkeley Arts Magnet at Whittier School, and Ruth Acty Elementary.
Ownership History
Date
Name
Owned For
Owner Type
Purchase Details
Closed on
Dec 13, 2017
Sold by
Cohen Brett Elliot
Bought by
Sims Stephen and Sims Leanne
Current Estimated Value
Home Financials for this Owner
Home Financials are based on the most recent Mortgage that was taken out on this home.
Original Mortgage
$1,148,000
Outstanding Balance
$964,761
Interest Rate
3.87%
Mortgage Type
Adjustable Rate Mortgage/ARM
Estimated Equity
$999,996
Purchase Details
Closed on
Jul 11, 2014
Sold by
Cohen Brett Elliot and Frances Cohen Revocable Trust
Bought by
Cohen Brett Elliot
Purchase Details
Closed on
Jul 6, 2010
Sold by
Cohen Frances
Bought by
Cohen Frances and The Frances Cohen Revocable Tr
Create a Home Valuation Report for This Property
The Home Valuation Report is an in-depth analysis detailing your home's value as well as a comparison with similar homes in the area
Home Values in the Area
Average Home Value in this Area
Purchase History
| Date | Buyer | Sale Price | Title Company |
|---|---|---|---|
| Sims Stephen | $1,435,000 | Old Republic Title Company | |
| Cohen Brett Elliot | -- | None Available | |
| Cohen Frances | -- | None Available |
Source: Public Records
Mortgage History
| Date | Status | Borrower | Loan Amount |
|---|---|---|---|
| Open | Sims Stephen | $1,148,000 |
Source: Public Records
Tax History
| Year | Tax Paid | Tax Assessment Tax Assessment Total Assessment is a certain percentage of the fair market value that is determined by local assessors to be the total taxable value of land and additions on the property. | Land | Improvement |
|---|---|---|---|---|
| 2025 | $22,630 | $1,632,757 | $568,905 | $1,063,852 |
| 2024 | $22,630 | $1,600,742 | $557,750 | $1,042,992 |
| 2023 | $22,145 | $1,569,359 | $546,815 | $1,022,544 |
| 2022 | $21,989 | $1,538,592 | $536,095 | $1,002,497 |
| 2021 | $22,082 | $1,508,428 | $525,585 | $982,843 |
| 2020 | $21,175 | $1,492,974 | $520,200 | $972,774 |
| 2019 | $20,623 | $1,463,700 | $510,000 | $953,700 |
| 2018 | $20,329 | $1,435,000 | $500,000 | $935,000 |
| 2017 | $6,270 | $313,084 | $90,152 | $222,932 |
| 2016 | $6,027 | $306,946 | $88,385 | $218,561 |
| 2015 | $5,925 | $302,336 | $87,057 | $215,279 |
| 2014 | $5,801 | $296,415 | $85,352 | $211,063 |
Source: Public Records
Map
Nearby Homes
- 582 Euclid Ave
- 614 Cragmont Ave
- 479 Kentucky Ave
- 265 Purdue Ave
- 385 Vermont Ave
- 483 Boynton Ave
- 549 Santa Barbara Rd
- 935 Grizzly Peak Blvd
- 770 Santa Barbara Rd
- 982 Grizzly Peak Blvd
- 225 Arlington Ave
- 201 Amherst Ave
- 1024 Miller Ave
- 826 Indian Rock Ave
- 1983 Yosemite Rd
- 46 Ardmore Rd
- 22 Windsor Ave
- 1106 Cragmont Ave
- 1119 Miller Ave
- 1110 Sterling Ave
- 559 Vistamont Ave
- 547 Vistamont Ave
- 551 Vistamont Ave
- 550 Vistamont Ave
- 561 Vistamont Ave
- 540 Vistamont Ave
- 560 Vistamont Ave
- 549 Vistamont Ave Unit Cottage
- 549 Vistamont Ave
- 530 Vistamont Ave
- 556 Wildcat Canyon Rd
- 3 Woodmont Ct
- 1 Rochdale Way
- 3 Rochdale Way
- 2 Woodmont Ct
- 570 Vistamont Ave
- 520 Vistamont Ave
- 4 Woodmont Ct
- 552 Wildcat Canyon Rd
- 551 Woodmont Ave
Your Personal Tour Guide
Ask me questions while you tour the home.