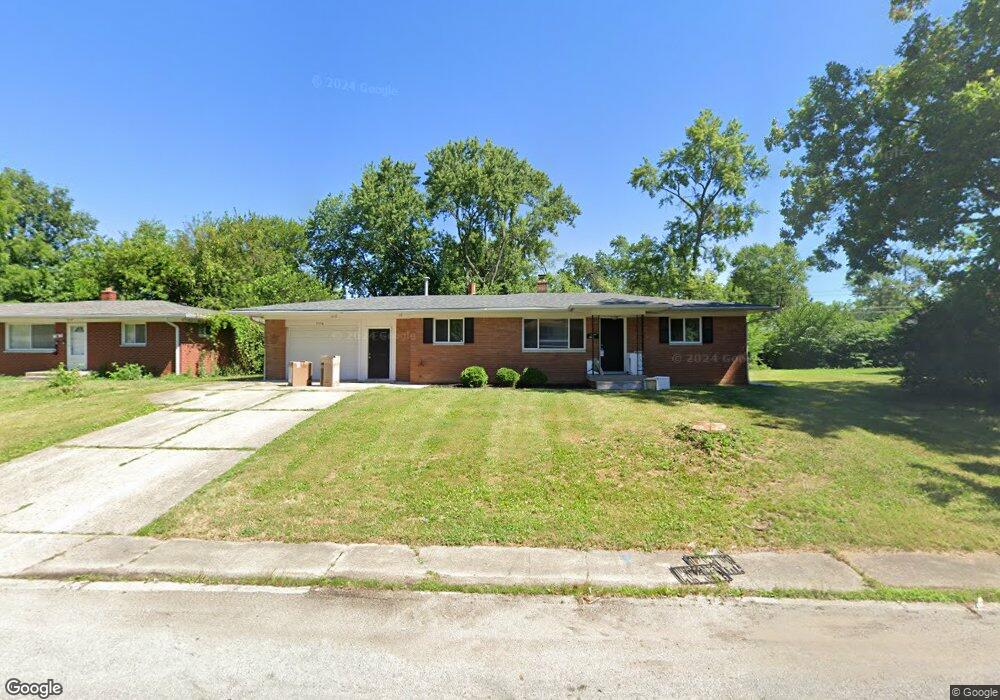
5556 Culver St Indianapolis, IN 46226
Devington NeighborhoodEstimated Value: $156,000 - $167,000
--
Bed
1
Bath
1,320
Sq Ft
$123/Sq Ft
Est. Value
About This Home
This home is located at 5556 Culver St, Indianapolis, IN 46226 and is currently estimated at $161,878, approximately $122 per square foot. 5556 Culver St is a home located in Marion County with nearby schools including Robert Lee Frost School 106, James Whitcomb Riley School 43, and Phalen Leadership Academy 93.
Ownership History
Date
Name
Owned For
Owner Type
Purchase Details
Closed on
Aug 3, 2023
Sold by
Tappi Juan J
Bought by
Dragon Shiryu Llc
Current Estimated Value
Purchase Details
Closed on
Mar 12, 2020
Sold by
Bard Rentals Llc
Bought by
Tappi Juan J
Home Financials for this Owner
Home Financials are based on the most recent Mortgage that was taken out on this home.
Original Mortgage
$71,175
Interest Rate
3.5%
Mortgage Type
New Conventional
Purchase Details
Closed on
Feb 9, 2017
Sold by
Kiley Brett
Bought by
Bard Rentals Llc
Purchase Details
Closed on
Aug 9, 2016
Sold by
Equity Trust Co
Bought by
Kiley Brett
Home Financials for this Owner
Home Financials are based on the most recent Mortgage that was taken out on this home.
Original Mortgage
$54,675
Interest Rate
3.42%
Mortgage Type
New Conventional
Purchase Details
Closed on
Apr 29, 2016
Sold by
Grundy Roy R and Grundy Lula M
Bought by
Equity Trust Co and Mark Todd Roberts Ira
Create a Home Valuation Report for This Property
The Home Valuation Report is an in-depth analysis detailing your home's value as well as a comparison with similar homes in the area
Home Values in the Area
Average Home Value in this Area
Purchase History
| Date | Buyer | Sale Price | Title Company |
|---|---|---|---|
| Dragon Shiryu Llc | -- | None Listed On Document | |
| Tappi Juan J | $94,900 | Enterprise Title | |
| Bard Rentals Llc | -- | -- | |
| Kiley Brett | -- | None Available | |
| Equity Trust Co | $28,601 | None Available |
Source: Public Records
Mortgage History
| Date | Status | Borrower | Loan Amount |
|---|---|---|---|
| Previous Owner | Tappi Juan J | $71,175 | |
| Previous Owner | Kiley Brett | $54,675 |
Source: Public Records
Tax History Compared to Growth
Tax History
| Year | Tax Paid | Tax Assessment Tax Assessment Total Assessment is a certain percentage of the fair market value that is determined by local assessors to be the total taxable value of land and additions on the property. | Land | Improvement |
|---|---|---|---|---|
| 2024 | $3,418 | $150,000 | $8,100 | $141,900 |
| 2023 | $3,418 | $139,600 | $8,100 | $131,500 |
| 2022 | $3,213 | $131,700 | $8,100 | $123,600 |
| 2021 | $2,166 | $89,500 | $8,100 | $81,400 |
| 2020 | $1,848 | $75,500 | $5,100 | $70,400 |
| 2019 | $1,811 | $72,600 | $5,100 | $67,500 |
| 2018 | $1,686 | $66,800 | $5,100 | $61,700 |
| 2017 | $1,389 | $61,100 | $5,100 | $56,000 |
| 2016 | $376 | $56,100 | $5,100 | $51,000 |
| 2014 | $414 | $69,300 | $5,100 | $64,200 |
| 2013 | $729 | $90,000 | $5,100 | $84,900 |
Source: Public Records
Map
Nearby Homes
- 3946 N Layman Ave
- 4101 N Ritter Ave
- 3842 Priscilla Ave
- 4213 N Audubon Rd
- 4025 N Campbell Ave
- 4126 Flamingo Dr W
- 3701 N Audubon Rd
- 4101 N Arlington Ave
- 3644 N Priscilla Ct
- 6108 Roselawn Dr
- 5894 Meadowlark Dr
- 3607 N Graham Ave
- 3561 N Graham Ave
- 6117 Marilyn Rd
- 3737 N Butler Ave
- 6134 Marilyn Rd
- 3506 N Lesley Ave
- 3505 N Layman Ave
- 4016 N Emerson Ave
- 6143 E 43rd St
- 5546 Culver St
- 5602 Culver St
- 5557 Glencoe St
- 5547 Glencoe St
- 5542 Culver St
- 5601 Culver St
- 5547 Culver St
- 5605 Culver St
- 5606 Culver St
- 5543 Glencoe St
- 5543 Culver St
- 5530 Culver St
- 5611 Culver St
- 5602 Glencoe St
- 5531 Glencoe St
- 5531 Culver St
- 5602 E 40th St
- 5606 Glencoe St
- 5606 E 40th St
- 5556 Glencoe St