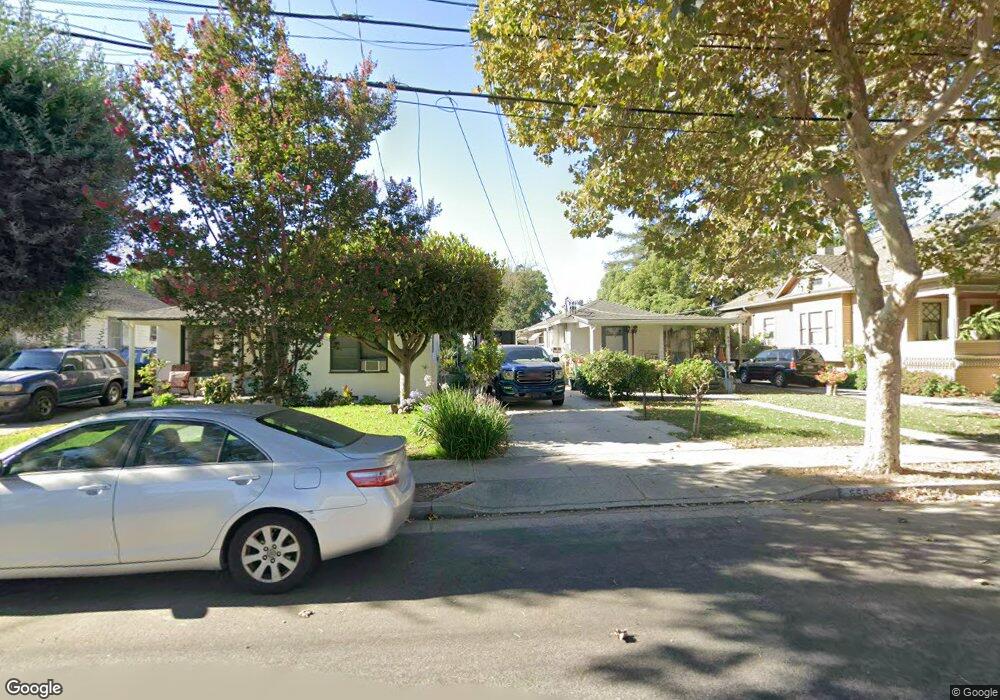
556 Fuller Ave Unit 9 San Jose, CA 95125
Willow Glen NeighborhoodEstimated Value: $941,000 - $1,172,984
1
Bed
1
Bath
752
Sq Ft
$1,448/Sq Ft
Est. Value
About This Home
This home is located at 556 Fuller Ave Unit 9, San Jose, CA 95125 and is currently estimated at $1,088,996, approximately $1,448 per square foot. 556 Fuller Ave Unit 9 is a home located in Santa Clara County with nearby schools including Willow Glen Elementary, Herbert Hoover Middle School, and Abraham Lincoln High.
Ownership History
Date
Name
Owned For
Owner Type
Purchase Details
Closed on
Jun 27, 2005
Sold by
Wood Clayton
Bought by
Wood Julia
Current Estimated Value
Home Financials for this Owner
Home Financials are based on the most recent Mortgage that was taken out on this home.
Original Mortgage
$422,500
Outstanding Balance
$152,661
Interest Rate
1%
Mortgage Type
New Conventional
Estimated Equity
$936,335
Purchase Details
Closed on
Sep 7, 2001
Sold by
Vo Thu T
Bought by
Herceg Paul R
Home Financials for this Owner
Home Financials are based on the most recent Mortgage that was taken out on this home.
Original Mortgage
$216,000
Interest Rate
7%
Purchase Details
Closed on
Mar 13, 2000
Sold by
Hix James R and Hix Michele M
Bought by
Wood Clayton and Wood Julia
Home Financials for this Owner
Home Financials are based on the most recent Mortgage that was taken out on this home.
Original Mortgage
$240,000
Interest Rate
8.21%
Purchase Details
Closed on
Jun 22, 1994
Sold by
Landis Willis D and Landis Isabella Ruth
Bought by
Hix James Roy and Hix Michele Marie
Home Financials for this Owner
Home Financials are based on the most recent Mortgage that was taken out on this home.
Original Mortgage
$140,760
Interest Rate
8.53%
Mortgage Type
Assumption
Create a Home Valuation Report for This Property
The Home Valuation Report is an in-depth analysis detailing your home's value as well as a comparison with similar homes in the area
Home Values in the Area
Average Home Value in this Area
Purchase History
| Date | Buyer | Sale Price | Title Company |
|---|---|---|---|
| Wood Julia | -- | First American Title Company | |
| Herceg Paul R | $270,000 | Chicago Title Co | |
| Wood Clayton | $300,000 | Financial Title Company | |
| Hix James Roy | $139,000 | Fidelity National Title Co |
Source: Public Records
Mortgage History
| Date | Status | Borrower | Loan Amount |
|---|---|---|---|
| Open | Wood Julia | $422,500 | |
| Closed | Herceg Paul R | $216,000 | |
| Previous Owner | Wood Clayton | $240,000 | |
| Previous Owner | Hix James Roy | $140,760 |
Source: Public Records
Tax History Compared to Growth
Tax History
| Year | Tax Paid | Tax Assessment Tax Assessment Total Assessment is a certain percentage of the fair market value that is determined by local assessors to be the total taxable value of land and additions on the property. | Land | Improvement |
|---|---|---|---|---|
| 2025 | $7,336 | $461,066 | $230,533 | $230,533 |
| 2024 | $7,336 | $452,026 | $226,013 | $226,013 |
| 2023 | $6,541 | $443,164 | $221,582 | $221,582 |
| 2022 | $6,484 | $434,476 | $217,238 | $217,238 |
| 2021 | $6,316 | $425,958 | $212,979 | $212,979 |
| 2020 | $6,144 | $421,592 | $210,796 | $210,796 |
| 2019 | $5,997 | $413,326 | $206,663 | $206,663 |
| 2018 | $5,923 | $405,222 | $202,611 | $202,611 |
| 2017 | $5,865 | $397,278 | $198,639 | $198,639 |
| 2016 | $5,707 | $389,490 | $194,745 | $194,745 |
| 2015 | $5,659 | $383,640 | $191,820 | $191,820 |
| 2014 | $5,225 | $376,126 | $188,063 | $188,063 |
Source: Public Records
Map
Nearby Homes
- 841 Willis Ave
- 470 Jerome St
- 715 Harrison St
- 408 Fuller Ave
- 546 Coe Ave
- 747 Coe Ave
- 986 Spencer Ave
- 1025 Delmas Ave
- 502 Hannah St
- 975 Prevost St
- 943 Riverside Dr
- 1124 Delmas Ave
- 809 Auzerais Ave Unit 429
- 935 Chabrant Way
- 311 Bautista Place
- 1206 Clark St
- 501 Minnesota Ave
- 1044 Lincoln Ave
- 1087 Merle Ave
- 1249 Prevost St