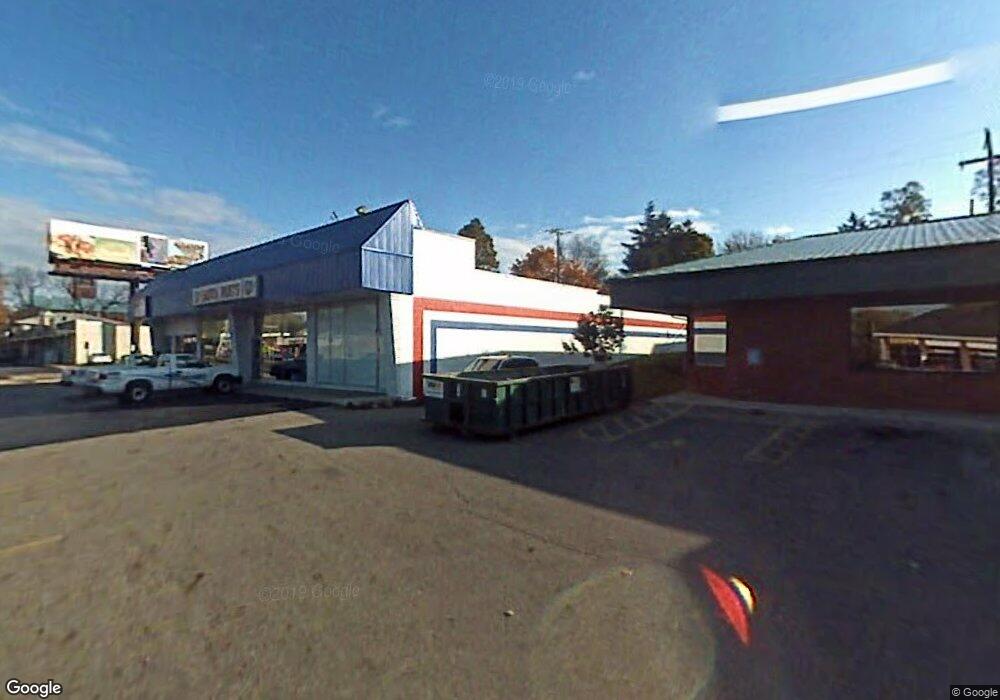
5562 N High St Columbus, OH 43214
Clintonville NeighborhoodEstimated Value: $769,307
--
Bed
--
Bath
6,885
Sq Ft
$112/Sq Ft
Est. Value
About This Home
This home is located at 5562 N High St, Columbus, OH 43214 and is currently estimated at $769,307, approximately $111 per square foot. 5562 N High St is a home located in Franklin County with nearby schools including Salem Elementary School, Dominion Middle School, and Whetstone High School.
Ownership History
Date
Name
Owned For
Owner Type
Purchase Details
Closed on
May 16, 2022
Sold by
Core Acquisitions Llc
Bought by
City Of Columbus Ohio
Current Estimated Value
Purchase Details
Closed on
Apr 15, 2022
Sold by
Core Acquisitions Llc
Bought by
City Of Columbus Ohio
Purchase Details
Closed on
Sep 13, 2019
Sold by
Wk Enterprises I Llc
Bought by
Core Acquisitions Llc
Purchase Details
Closed on
Nov 14, 2006
Sold by
Klatt Werner G
Bought by
Wk Enterprises I Llc
Purchase Details
Closed on
May 22, 1996
Sold by
Nitro Properties
Bought by
Klatt Werner G and Klatt Kathryn F
Home Financials for this Owner
Home Financials are based on the most recent Mortgage that was taken out on this home.
Original Mortgage
$200,000
Interest Rate
8.1%
Mortgage Type
Commercial
Purchase Details
Closed on
Jan 1, 1984
Create a Home Valuation Report for This Property
The Home Valuation Report is an in-depth analysis detailing your home's value as well as a comparison with similar homes in the area
Home Values in the Area
Average Home Value in this Area
Purchase History
| Date | Buyer | Sale Price | Title Company |
|---|---|---|---|
| City Of Columbus Ohio | -- | Roseboro Anthony M | |
| City Of Columbus Ohio | -- | Roseboro Anthony M | |
| Core Acquisitions Llc | $580,000 | Valmer Land Title Box | |
| Wk Enterprises I Llc | -- | Title Pro | |
| Klatt Werner G | $325,000 | -- | |
| -- | $275,000 | -- |
Source: Public Records
Mortgage History
| Date | Status | Borrower | Loan Amount |
|---|---|---|---|
| Previous Owner | Klatt Werner G | $200,000 |
Source: Public Records
Tax History Compared to Growth
Tax History
| Year | Tax Paid | Tax Assessment Tax Assessment Total Assessment is a certain percentage of the fair market value that is determined by local assessors to be the total taxable value of land and additions on the property. | Land | Improvement |
|---|---|---|---|---|
| 2024 | $16,327 | $219,980 | $62,620 | $157,360 |
| 2023 | $16,069 | $219,980 | $62,620 | $157,360 |
| 2022 | $12,849 | $171,330 | $46,130 | $125,200 |
| 2021 | $12,904 | $171,330 | $46,130 | $125,200 |
| 2020 | $12,815 | $171,330 | $46,130 | $125,200 |
| 2019 | $12,828 | $155,750 | $41,930 | $113,820 |
| 2018 | $6,406 | $155,750 | $41,930 | $113,820 |
| 2017 | $12,813 | $155,750 | $41,930 | $113,820 |
| 2016 | $13,554 | $155,750 | $41,930 | $113,820 |
| 2015 | $6,314 | $155,750 | $41,930 | $113,820 |
| 2014 | $12,579 | $155,750 | $41,930 | $113,820 |
| 2013 | $6,257 | $155,750 | $41,930 | $113,820 |
Source: Public Records
Map
Nearby Homes
- 5542 Emerson Ave
- 5508 Emerson Ave
- 5584 Morning St
- 87 Charleston Ave
- 131 Broad Meadows Blvd
- 162 Broad Meadows Blvd
- 142 Rosslyn Ave
- 5935 N High St Unit 108
- 353 Kenbrook Dr
- 252 W Kanawha Ave
- 5364 Sharon Ave
- 290 W Kanawha Ave
- 123 W South St
- 301 W Riverglen Dr
- 287 Fenway Rd Unit B
- 569 Chase Rd
- 5200 Fenway Ct Unit A
- 582 E Lincoln Ave
- 590 Keyes Ln
- 415 E South St