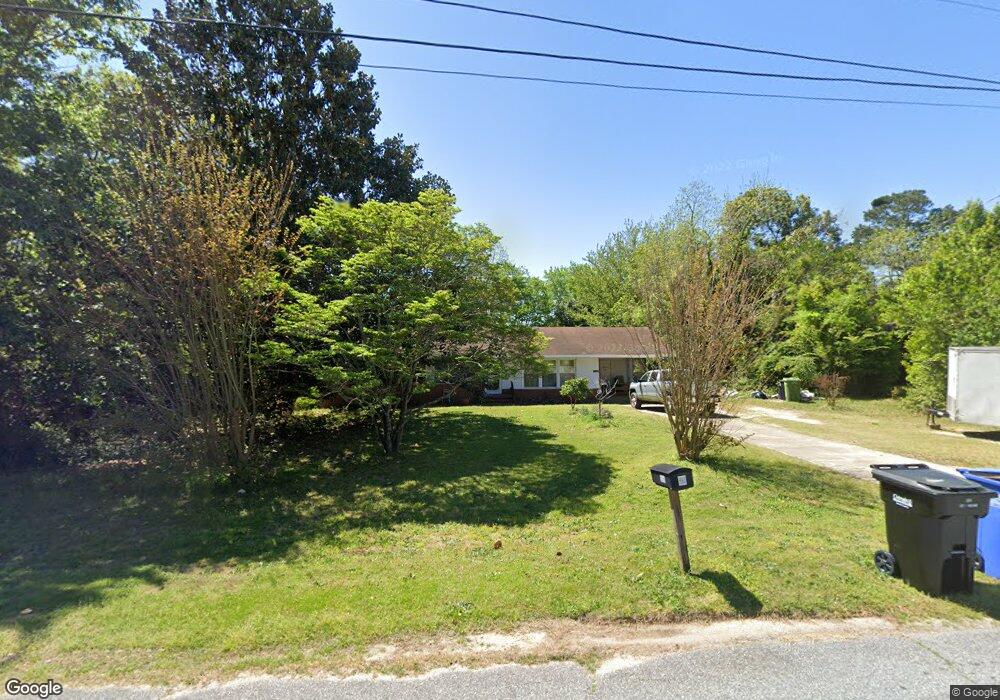
5566 Glenview Dr Columbus, GA 31907
East Columbus NeighborhoodEstimated Value: $144,425 - $173,000
3
Beds
3
Baths
1,360
Sq Ft
$117/Sq Ft
Est. Value
About This Home
This home is located at 5566 Glenview Dr, Columbus, GA 31907 and is currently estimated at $159,606, approximately $117 per square foot. 5566 Glenview Dr is a home located in Muscogee County with nearby schools including Wesley Heights Elementary School, East Columbus Magnet Academy, and Kendrick High School.
Ownership History
Date
Name
Owned For
Owner Type
Purchase Details
Closed on
Aug 12, 2011
Sold by
Chi Asset Management Llc
Bought by
Shabazz Alfaire Fountaine
Current Estimated Value
Home Financials for this Owner
Home Financials are based on the most recent Mortgage that was taken out on this home.
Original Mortgage
$81,500
Outstanding Balance
$55,432
Interest Rate
4.5%
Mortgage Type
FHA
Estimated Equity
$104,174
Purchase Details
Closed on
Dec 1, 2010
Sold by
Columbus Housing Initiative Inc
Bought by
Chi Asset Management Llc
Purchase Details
Closed on
May 19, 2010
Sold by
Hsbc Bank Usa Na
Bought by
Columbus Housing Initiative Inc
Purchase Details
Closed on
Aug 4, 2009
Sold by
Walker Larry L
Bought by
Hsbc Bank Usa Na
Create a Home Valuation Report for This Property
The Home Valuation Report is an in-depth analysis detailing your home's value as well as a comparison with similar homes in the area
Home Values in the Area
Average Home Value in this Area
Purchase History
| Date | Buyer | Sale Price | Title Company |
|---|---|---|---|
| Shabazz Alfaire Fountaine | $94,000 | -- | |
| Chi Asset Management Llc | -- | None Available | |
| Columbus Housing Initiative Inc | -- | None Available | |
| Hsbc Bank Usa Na | $111,788 | None Available |
Source: Public Records
Mortgage History
| Date | Status | Borrower | Loan Amount |
|---|---|---|---|
| Open | Shabazz Alfaire Fountaine | $81,500 | |
| Closed | Shabazz Alfaire Fountaine | $12,500 |
Source: Public Records
Tax History
| Year | Tax Paid | Tax Assessment Tax Assessment Total Assessment is a certain percentage of the fair market value that is determined by local assessors to be the total taxable value of land and additions on the property. | Land | Improvement |
|---|---|---|---|---|
| 2025 | $956 | $46,180 | $9,688 | $36,492 |
| 2024 | $955 | $46,180 | $9,688 | $36,492 |
| 2023 | $266 | $46,180 | $9,688 | $36,492 |
| 2022 | $995 | $36,160 | $9,688 | $26,472 |
| 2021 | $988 | $36,220 | $9,688 | $26,532 |
| 2020 | $989 | $36,220 | $9,688 | $26,532 |
| 2019 | $994 | $36,220 | $9,688 | $26,532 |
| 2018 | $994 | $36,220 | $9,688 | $26,532 |
| 2017 | $999 | $36,220 | $9,688 | $26,532 |
| 2016 | $1,004 | $39,853 | $4,520 | $35,333 |
| 2015 | $1,005 | $39,853 | $4,520 | $35,333 |
| 2014 | $1,007 | $39,853 | $4,520 | $35,333 |
| 2013 | -- | $39,853 | $4,520 | $35,333 |
Source: Public Records
Map
Nearby Homes
- 6213 Fitzgerald Dr
- 6270 Mill Branch Rd
- 6021 Luna Dr
- 6033 Luna Dr
- 6061 Luna Dr
- 6040 Luna Dr
- 5834 Blueridge Dr
- 6293 Dupree Dr
- 1314 Pagoda Dr
- 5802 Blueridge Dr
- 5773 Marlette Ct
- 1524 Mazor Dr
- 5725 Marlette Ct
- 1925 Woodhollow Dr
- 6224 Valencia Dr
- 2312 Burnside Dr
- 1252 School House Dr
- 2525 Corineth Dr
- 6311 Morning Dew Dr
- 6303 Morning Dew Dr
- 5576 Glenview Dr
- 5556 Glenview Dr
- 6031 Cordova Rd
- 6037 Cordova Rd
- 6025 Cordova Rd
- 6055 Cordova Rd
- 5565 Glenview Dr
- 6023 Cordova Rd
- 5546 Glenview Dr
- 5575 Glenview Dr
- 5555 Glenview Dr
- 6021 Cordova Rd
- 1606 Celeste Dr
- 1618 Celeste Dr
- 5545 Glenview Dr
- 6019 Cordova Rd
- 5532 Glenview Dr
- 6050 Cordova Rd
- 6044 Cordova Rd
- 6052 Cordova Rd
Your Personal Tour Guide
Ask me questions while you tour the home.