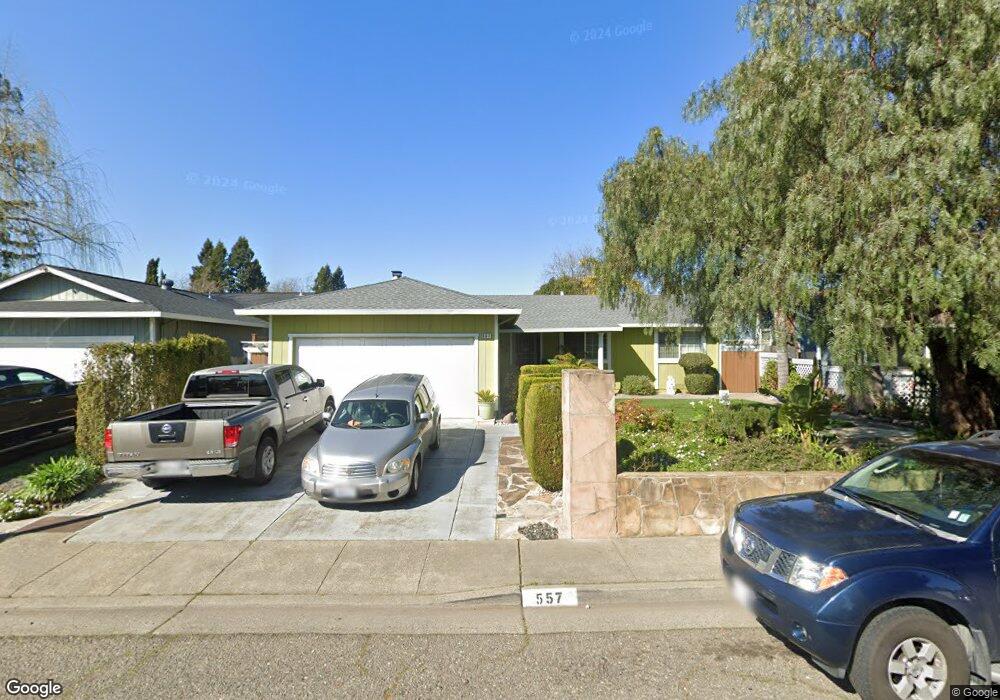
557 Funston Dr Santa Rosa, CA 95407
Roseland NeighborhoodEstimated Value: $571,000 - $601,000
3
Beds
2
Baths
1,077
Sq Ft
$543/Sq Ft
Est. Value
About This Home
This home is located at 557 Funston Dr, Santa Rosa, CA 95407 and is currently estimated at $585,093, approximately $543 per square foot. 557 Funston Dr is a home located in Sonoma County with nearby schools including Elsie Allen High School, Kid Street Charter School, and St. Michael's Orthodox School.
Ownership History
Date
Name
Owned For
Owner Type
Purchase Details
Closed on
Apr 27, 2020
Sold by
Palominos Febronio and Palominos Maria L
Bought by
Palominos Febronio and Palominos Maria
Current Estimated Value
Home Financials for this Owner
Home Financials are based on the most recent Mortgage that was taken out on this home.
Original Mortgage
$394,460
Outstanding Balance
$350,849
Interest Rate
3.5%
Mortgage Type
FHA
Estimated Equity
$234,244
Purchase Details
Closed on
Oct 17, 2013
Sold by
Lonacker Patricia L
Bought by
Lonacker Patricia L
Purchase Details
Closed on
Apr 23, 2003
Sold by
Padilla Dan R
Bought by
Palominos Febronio and Palominos Maria L
Home Financials for this Owner
Home Financials are based on the most recent Mortgage that was taken out on this home.
Original Mortgage
$272,000
Interest Rate
5.95%
Create a Home Valuation Report for This Property
The Home Valuation Report is an in-depth analysis detailing your home's value as well as a comparison with similar homes in the area
Home Values in the Area
Average Home Value in this Area
Purchase History
| Date | Buyer | Sale Price | Title Company |
|---|---|---|---|
| Palominos Febronio | $131,500 | Fidelity National Title Co | |
| Lonacker Patricia L | -- | None Available | |
| Palominos Febronio | $320,000 | Old Republic Title Co |
Source: Public Records
Mortgage History
| Date | Status | Borrower | Loan Amount |
|---|---|---|---|
| Open | Palominos Febronio | $394,460 | |
| Previous Owner | Palominos Febronio | $272,000 | |
| Closed | Palominos Febronio | $48,000 |
Source: Public Records
Tax History
| Year | Tax Paid | Tax Assessment Tax Assessment Total Assessment is a certain percentage of the fair market value that is determined by local assessors to be the total taxable value of land and additions on the property. | Land | Improvement |
|---|---|---|---|---|
| 2025 | $6,325 | $463,462 | $159,310 | $304,152 |
| 2024 | $6,325 | $454,376 | $156,187 | $298,189 |
| 2023 | $6,325 | $445,468 | $153,125 | $292,343 |
| 2022 | $6,269 | $436,734 | $150,123 | $286,611 |
| 2021 | $6,401 | $428,172 | $147,180 | $280,992 |
| 2020 | $6,028 | $423,782 | $145,671 | $278,111 |
| 2019 | $5,778 | $415,473 | $142,815 | $272,658 |
| 2018 | $5,681 | $407,327 | $140,015 | $267,312 |
| 2017 | $5,385 | $399,341 | $137,270 | $262,071 |
| 2016 | $4,739 | $341,000 | $117,000 | $224,000 |
| 2015 | $4,658 | $342,000 | $118,000 | $224,000 |
| 2014 | $4,162 | $307,000 | $106,000 | $201,000 |
Source: Public Records
Map
Nearby Homes
- 0 West Ave Unit 325019616
- 1704 Dutton Ave
- 182 Torzelli Ln
- 1960 Las Ventanas Dr
- 1863 Beachwood Dr
- 1962 Las Ventanas Dr
- 733 Leo Dr
- 2315 West Ave
- 465 Miaterra Dr
- 919 Naify Ln
- 1911 Corby Ave
- 780 Dutton Ave
- 1128 Hearn Ave
- 2549 Corby Ave
- 487 Hearn Ave
- 48 Yarrow Way
- 101 Colgan Ave Unit 25
- 588 Roseland Ave
- 62 Romani Ct
- 1461 Trombetta St
Your Personal Tour Guide
Ask me questions while you tour the home.