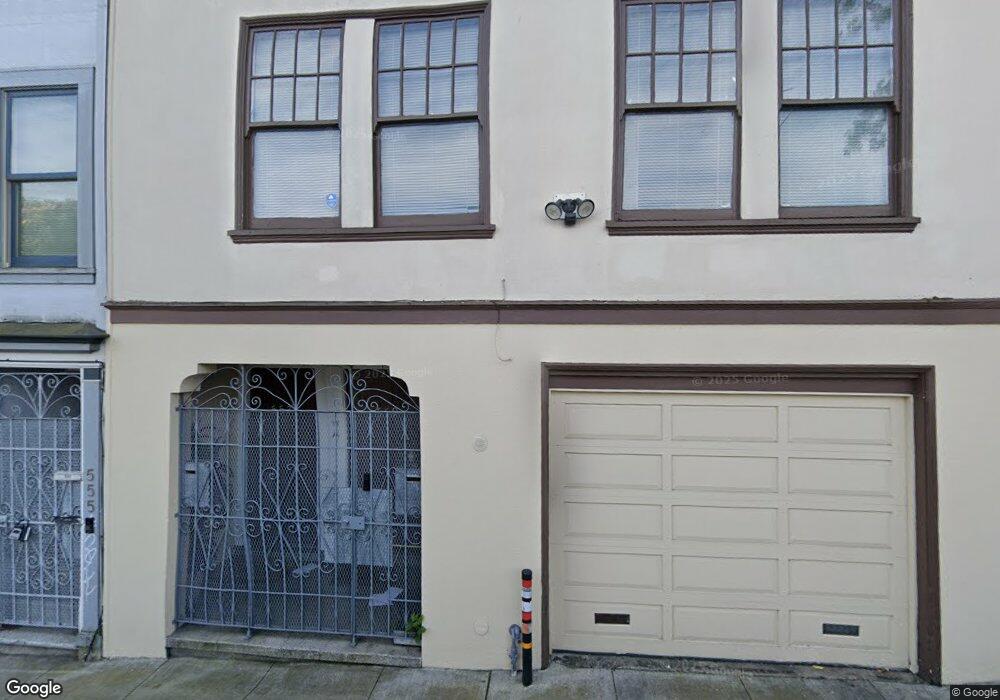
557 Ivy St Unit 559 San Francisco, CA 94102
Hayes Valley NeighborhoodEstimated Value: $1,209,000 - $1,974,780
2
Beds
2
Baths
1,978
Sq Ft
$750/Sq Ft
Est. Value
About This Home
This home is located at 557 Ivy St Unit 559, San Francisco, CA 94102 and is currently estimated at $1,483,945, approximately $750 per square foot. 557 Ivy St Unit 559 is a home located in San Francisco County with nearby schools including Muir (John) Elementary School, James Lick Middle School, and San Francisco Schoolhouse.
Ownership History
Date
Name
Owned For
Owner Type
Purchase Details
Closed on
May 17, 2013
Sold by
Gabbac Leoncio S and Gabbac Milagros M
Bought by
Gabbac Leoncio S and Gabbac Milagros M
Current Estimated Value
Home Financials for this Owner
Home Financials are based on the most recent Mortgage that was taken out on this home.
Original Mortgage
$718,000
Outstanding Balance
$506,489
Interest Rate
3.38%
Mortgage Type
Commercial
Estimated Equity
$977,456
Purchase Details
Closed on
Aug 25, 2003
Sold by
Vera Jess P and Vera Evangeline R
Bought by
Gabbac Leoncio and Gabbac Milagros
Home Financials for this Owner
Home Financials are based on the most recent Mortgage that was taken out on this home.
Original Mortgage
$540,000
Interest Rate
5.5%
Mortgage Type
Commercial
Create a Home Valuation Report for This Property
The Home Valuation Report is an in-depth analysis detailing your home's value as well as a comparison with similar homes in the area
Home Values in the Area
Average Home Value in this Area
Purchase History
| Date | Buyer | Sale Price | Title Company |
|---|---|---|---|
| Gabbac Leoncio S | -- | First American Title Company | |
| Gabbac Leoncio | $675,000 | First American Title Company |
Source: Public Records
Mortgage History
| Date | Status | Borrower | Loan Amount |
|---|---|---|---|
| Open | Gabbac Leoncio S | $718,000 | |
| Closed | Gabbac Leoncio | $540,000 | |
| Closed | Gabbac Leoncio | $67,500 |
Source: Public Records
Tax History Compared to Growth
Tax History
| Year | Tax Paid | Tax Assessment Tax Assessment Total Assessment is a certain percentage of the fair market value that is determined by local assessors to be the total taxable value of land and additions on the property. | Land | Improvement |
|---|---|---|---|---|
| 2025 | $11,728 | $959,641 | $575,793 | $383,848 |
| 2024 | $11,728 | $940,828 | $564,504 | $376,324 |
| 2023 | $11,546 | $922,384 | $553,437 | $368,947 |
| 2022 | $11,318 | $904,300 | $542,586 | $361,714 |
| 2021 | $11,114 | $886,570 | $531,948 | $354,622 |
| 2020 | $11,223 | $877,480 | $526,494 | $350,986 |
| 2019 | $10,840 | $860,275 | $516,171 | $344,104 |
| 2018 | $10,470 | $843,321 | $505,995 | $337,326 |
| 2017 | $10,047 | $826,788 | $496,074 | $330,714 |
| 2016 | $9,868 | $810,579 | $486,348 | $324,231 |
| 2015 | $9,741 | $798,405 | $479,043 | $319,362 |
| 2014 | $9,484 | $782,769 | $469,662 | $313,107 |
Source: Public Records
Map
Nearby Homes
- 634 Laguna St Unit C
- 469 Ivy St
- 610 Buchanan St Unit 1
- 462-466 Linden St
- 675-677 Ivy St
- 675 Ivy St Unit 677
- 555 Fulton St Unit 518
- 555 Fulton St Unit 427
- 555 Fulton St Unit 322
- 615-617 Octavia St
- 450 Hayes St Unit 3H
- 841 Fulton St
- 430 Hayes St Unit 201
- 745 Fillmore St
- 538 Page St
- 536 Page St
- 534 Page St
- 163 Octavia St
- 388 Fulton St Unit 208
- 388 Fulton St Unit 603
- 551 Ivy St
- 555 Ivy St
- 565 Ivy St Unit 567
- 571 Ivy St
- 569 Ivy St
- 644 Hayes St Unit 648
- 658 Hayes St
- 656 Hayes St
- 660 Hayes St
- 650 Hayes St
- 652 Hayes St
- 541 Ivy St
- 662 Hayes St Unit 664
- 539 Ivy St
- 575 Ivy St Unit 579
- 670 Hayes St Unit 670
- 668 Hayes St Unit 668
- 535 Ivy St Unit 537
- 638 Hayes St
- 581 Ivy St