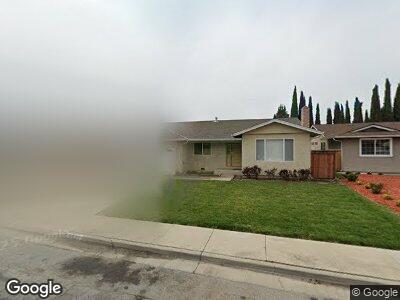
5579 Shadowcrest Way San Jose, CA 95123
Playa Del Rey NeighborhoodEstimated Value: $1,457,000 - $1,656,058
4
Beds
2
Baths
1,804
Sq Ft
$858/Sq Ft
Est. Value
About This Home
This home is located at 5579 Shadowcrest Way, San Jose, CA 95123 and is currently estimated at $1,547,765, approximately $857 per square foot. 5579 Shadowcrest Way is a home located in Santa Clara County with nearby schools including Frost (Earl) Elementary School, Herman (Leonard) Intermediate School, and Santa Teresa High School.
Ownership History
Date
Name
Owned For
Owner Type
Purchase Details
Closed on
Oct 18, 2011
Sold by
Khatri Sanjay V and Khatri Yogita S
Bought by
Khatri Sanjay and Khatri Yogita S
Current Estimated Value
Purchase Details
Closed on
Jul 25, 2002
Sold by
Khatri Sanjay V and Khatri Yogita S
Bought by
Khatri Sanjay and Khatri Yogita S
Home Financials for this Owner
Home Financials are based on the most recent Mortgage that was taken out on this home.
Original Mortgage
$252,500
Interest Rate
6.6%
Purchase Details
Closed on
May 11, 1998
Sold by
Kilaita Khanna D and Kilaita Anthony J
Bought by
Khatri Sanjay
Home Financials for this Owner
Home Financials are based on the most recent Mortgage that was taken out on this home.
Original Mortgage
$254,400
Interest Rate
7.13%
Create a Home Valuation Report for This Property
The Home Valuation Report is an in-depth analysis detailing your home's value as well as a comparison with similar homes in the area
Home Values in the Area
Average Home Value in this Area
Purchase History
| Date | Buyer | Sale Price | Title Company |
|---|---|---|---|
| Khatri Sanjay | -- | None Available | |
| Khatri Sanjay | -- | New Century Title Company | |
| Khatri Sanjay | $954,000 | First American Title Guarant |
Source: Public Records
Mortgage History
| Date | Status | Borrower | Loan Amount |
|---|---|---|---|
| Open | Khatri Sanjay | $240,800 | |
| Closed | Khatri Sanjay | $250,000 | |
| Closed | Khatri Sanjay | $257,029 | |
| Closed | Khatri Sanjay | $263,442 | |
| Closed | Khatri Sanjay | $271,000 | |
| Closed | Khatri Sanjay | $322,000 | |
| Closed | Khatri Sanjay | $252,500 | |
| Closed | Khatri Sanjay | $254,400 |
Source: Public Records
Tax History Compared to Growth
Tax History
| Year | Tax Paid | Tax Assessment Tax Assessment Total Assessment is a certain percentage of the fair market value that is determined by local assessors to be the total taxable value of land and additions on the property. | Land | Improvement |
|---|---|---|---|---|
| 2024 | $7,658 | $497,794 | $187,844 | $309,950 |
| 2023 | $7,519 | $488,034 | $184,161 | $303,873 |
| 2022 | $7,471 | $478,465 | $180,550 | $297,915 |
| 2021 | $7,332 | $469,084 | $177,010 | $292,074 |
| 2020 | $7,151 | $464,275 | $175,195 | $289,080 |
| 2019 | $6,975 | $455,172 | $171,760 | $283,412 |
| 2018 | $6,915 | $446,248 | $168,393 | $277,855 |
| 2017 | $6,818 | $437,499 | $165,092 | $272,407 |
| 2016 | $6,488 | $428,921 | $161,855 | $267,066 |
| 2015 | $6,339 | $422,479 | $159,424 | $263,055 |
| 2014 | $5,703 | $414,205 | $156,302 | $257,903 |
Source: Public Records
Map
Nearby Homes
- 5501 Shadowcrest Way
- 5699 Saxony Ct
- 569 Blairburry Way
- 717 Bolivar Dr
- 5731 Indian Ave
- 5490 Don Diego Ct
- 5571 Sunny Oaks Dr
- 653 Navajo Ct
- 676 Bolivar Dr
- 5465 Don Edmondo Ct
- 763 Delaware Ave Unit 4
- 410 Colony Cove Dr
- 701 Natoma Dr
- 771 Delaware Ave Unit 3
- 5630 New Ct
- 5446 Colony Field Dr
- 5426 Colony Green Dr
- 447 Colony Knoll Dr
- 441 Colony Knoll Dr
- 798 Blossom Hill Rd Unit 4
- 5579 Shadowcrest Way
- 5573 Shadowcrest Way
- 5585 Shadowcrest Way
- 5576 Southcrest Way
- 5567 Shadowcrest Way
- 5570 Southcrest Way
- 5591 Shadowcrest Way
- 5582 Southcrest Way
- 5580 Shadowcrest Way
- 5564 Southcrest Way
- 5586 Shadowcrest Way
- 5588 Southcrest Way
- 5574 Shadowcrest Way
- 5561 Shadowcrest Way
- 5597 Shadowcrest Way
- 5592 Shadowcrest Way
- 5568 Shadowcrest Way
- 5558 Southcrest Way
- 5594 Southcrest Way
- 5598 Shadowcrest Way