Estimated Value: $824,194 - $976,000
5
Beds
4
Baths
4,124
Sq Ft
$213/Sq Ft
Est. Value
About This Home
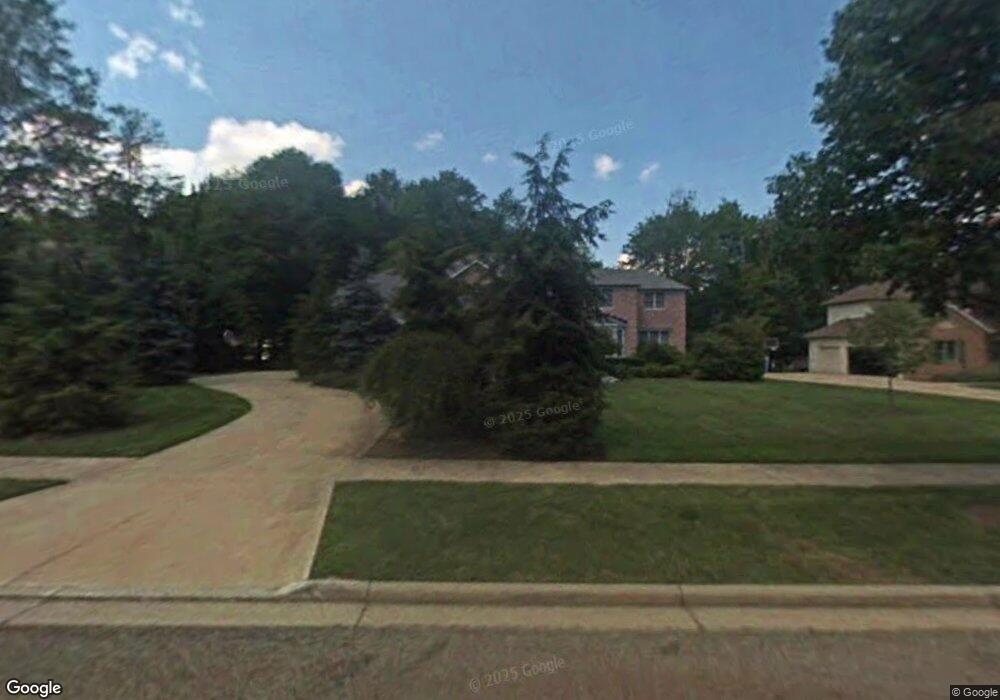
This home is located at 5586 High Point Rd, Solon, OH 44139 and is currently estimated at $877,549, approximately $212 per square foot. 5586 High Point Rd is a home located in Cuyahoga County with nearby schools including Dorothy E Lewis Elementary School, Orchard Middle School, and Solon Middle School.
Ownership History
Date
Name
Owned For
Owner Type
Purchase Details
Closed on
Oct 22, 2003
Sold by
Perlick James
Bought by
Goldman Harlan A and Goldman Amy H
Current Estimated Value
Home Financials for this Owner
Home Financials are based on the most recent Mortgage that was taken out on this home.
Original Mortgage
$385,000
Interest Rate
6.23%
Mortgage Type
Purchase Money Mortgage
Purchase Details
Closed on
Jun 26, 2001
Sold by
Perlick James
Bought by
Perlick James H and James H Perlick Trust
Purchase Details
Closed on
Aug 17, 1994
Sold by
Dinallo & Wittrup Homes
Bought by
Perlick James
Home Financials for this Owner
Home Financials are based on the most recent Mortgage that was taken out on this home.
Original Mortgage
$318,000
Interest Rate
8.73%
Mortgage Type
New Conventional
Purchase Details
Closed on
Nov 15, 1993
Sold by
Dinallo Richard E
Bought by
Dinallo & Wittrup Homes, Inc
Purchase Details
Closed on
Jan 1, 1992
Bought by
Dinallo Richard E
Create a Home Valuation Report for This Property
The Home Valuation Report is an in-depth analysis detailing your home's value as well as a comparison with similar homes in the area
Home Values in the Area
Average Home Value in this Area
Purchase History
| Date | Buyer | Sale Price | Title Company |
|---|---|---|---|
| Goldman Harlan A | $605,000 | Erie Title Agency Inc | |
| Perlick James H | -- | -- | |
| Perlick James | $424,800 | -- | |
| Dinallo & Wittrup Homes, Inc | $88,000 | -- | |
| Dinallo Richard E | -- | -- |
Source: Public Records
Mortgage History
| Date | Status | Borrower | Loan Amount |
|---|---|---|---|
| Closed | Goldman Harlan A | $385,000 | |
| Previous Owner | Perlick James | $318,000 |
Source: Public Records
Tax History
| Year | Tax Paid | Tax Assessment Tax Assessment Total Assessment is a certain percentage of the fair market value that is determined by local assessors to be the total taxable value of land and additions on the property. | Land | Improvement |
|---|---|---|---|---|
| 2024 | $15,728 | $287,420 | $35,070 | $252,350 |
| 2023 | $15,044 | $224,850 | $29,370 | $195,480 |
| 2022 | $15,012 | $224,840 | $29,370 | $195,480 |
| 2021 | $14,841 | $224,840 | $29,370 | $195,480 |
| 2020 | $15,909 | $220,430 | $28,810 | $191,630 |
| 2019 | $15,408 | $629,800 | $82,300 | $547,500 |
| 2018 | $14,156 | $220,430 | $28,810 | $191,630 |
| 2017 | $14,658 | $221,450 | $47,290 | $174,160 |
| 2016 | $14,520 | $221,450 | $47,290 | $174,160 |
| 2015 | $13,940 | $221,450 | $47,290 | $174,160 |
| 2014 | $13,940 | $205,040 | $43,790 | $161,250 |
Source: Public Records
Map
Nearby Homes
- 32760 Ledge Hill Dr
- 5721 Som Center Rd Unit 25
- 5721 Som Center Rd Unit 18
- 5560 Elm Hill Dr
- 34040 Sherbrook Park Dr
- 5910 Som Center Rd
- 34840 Sherwood Dr
- 33630 Carriage Park Dr
- 30705 Cannon Rd
- 5151 Som Center Rd
- 35906 Solon Rd
- 4775 Som Center Rd
- 32801 Baldwin Rd
- V/L (1.32 Acres) Aurora Rd
- 5070 Neptune Dr
- S/L 12 Neptune Oval
- S/L 1 Neptune Oval
- S/L 2 Neptune Oval
- S/L 11 Neptune Oval
- S/L 3 Neptune Oval
- 5592 High Point Rd
- 5580 High Point Rd
- 5562 High Point Rd
- 5598 High Point Rd
- 5556 High Point Rd
- 5589 High Point Rd
- 5585 High Point Rd
- 32890 Cannon Rd
- 5593 High Point Rd
- 32830 Cannon Rd
- 5581 High Point Rd
- 5565 High Point Rd
- 5597 High Point Rd
- 5571 High Point Rd
- 5577 High Point Rd
- 5557 High Point Rd
- 32770 Cannon Rd
- 32585 Timothy Cir
- 33005 Cannon Rd
- 32965 Cannon Rd
Your Personal Tour Guide
Ask me questions while you tour the home.