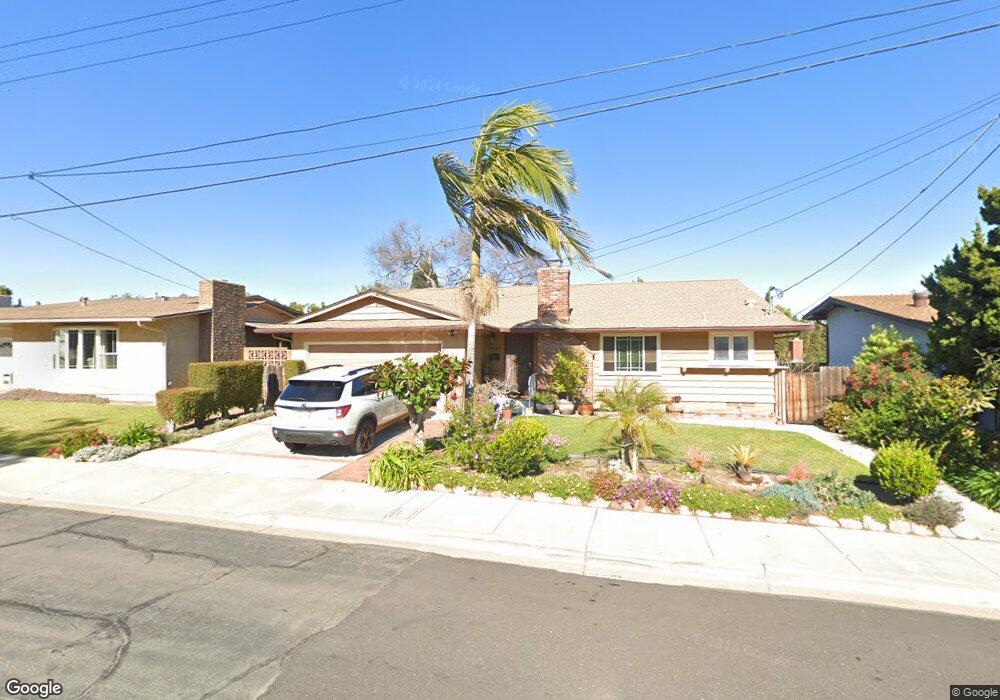
5587 Morro Way La Mesa, CA 91942
Estimated Value: $850,000 - $922,981
3
Beds
2
Baths
1,820
Sq Ft
$484/Sq Ft
Est. Value
About This Home
This home is located at 5587 Morro Way, La Mesa, CA 91942 and is currently estimated at $880,995, approximately $484 per square foot. 5587 Morro Way is a home located in San Diego County with nearby schools including Murray Manor Elementary School, Parkway Academy, and Grossmont High School.
Ownership History
Date
Name
Owned For
Owner Type
Purchase Details
Closed on
Dec 27, 2001
Sold by
Koski Miki O
Bought by
Koski Raymond and Koski Miki O
Current Estimated Value
Home Financials for this Owner
Home Financials are based on the most recent Mortgage that was taken out on this home.
Original Mortgage
$150,000
Interest Rate
6.73%
Mortgage Type
Balloon
Purchase Details
Closed on
Apr 13, 1999
Sold by
Hall Fern A Trust and Fern A
Bought by
Koski Miki O
Home Financials for this Owner
Home Financials are based on the most recent Mortgage that was taken out on this home.
Original Mortgage
$108,000
Interest Rate
6.98%
Mortgage Type
Stand Alone First
Purchase Details
Closed on
Dec 3, 1996
Sold by
Hall Fern A
Bought by
Hall Fern A
Purchase Details
Closed on
Sep 23, 1996
Sold by
Hall Fern A Trust and Fern A
Bought by
Hall Fern A
Create a Home Valuation Report for This Property
The Home Valuation Report is an in-depth analysis detailing your home's value as well as a comparison with similar homes in the area
Purchase History
| Date | Buyer | Sale Price | Title Company |
|---|---|---|---|
| Koski Raymond | -- | Commonwealth Land Title Co | |
| Koski Miki O | $216,000 | Fidelity National Title | |
| Koski Miki O | -- | Fidelity National Title | |
| Hall Fern A | -- | -- | |
| Hall Fern A | -- | -- |
Source: Public Records
Mortgage History
| Date | Status | Borrower | Loan Amount |
|---|---|---|---|
| Closed | Koski Raymond | $150,000 | |
| Closed | Koski Miki O | $108,000 |
Source: Public Records
Tax History
| Year | Tax Paid | Tax Assessment Tax Assessment Total Assessment is a certain percentage of the fair market value that is determined by local assessors to be the total taxable value of land and additions on the property. | Land | Improvement |
|---|---|---|---|---|
| 2025 | $4,610 | $338,603 | $125,404 | $213,199 |
| 2024 | $4,610 | $331,965 | $122,946 | $209,019 |
| 2023 | $4,449 | $325,457 | $120,536 | $204,921 |
| 2022 | $4,359 | $319,076 | $118,173 | $200,903 |
| 2021 | $4,294 | $312,820 | $115,856 | $196,964 |
| 2020 | $4,166 | $309,614 | $114,669 | $194,945 |
| 2019 | $4,074 | $303,544 | $112,421 | $191,123 |
| 2018 | $3,987 | $297,593 | $110,217 | $187,376 |
| 2017 | $50 | $291,758 | $108,056 | $183,702 |
| 2016 | $3,803 | $286,038 | $105,938 | $180,100 |
| 2015 | $3,766 | $281,742 | $104,347 | $177,395 |
| 2014 | $3,660 | $276,224 | $102,303 | $173,921 |
Source: Public Records
Map
Nearby Homes
- 8220 Vincetta Dr Unit 26
- 5350 Baltimore Dr Unit 5
- 5350 Baltimore Dr Unit 22
- 5350 Baltimore Dr Unit 47
- 5455 Baltimore Dr Unit 21
- 5440 Baltimore Dr Unit 178
- 5440 Baltimore Dr Unit 141
- 8100 Place
- 5661 Lake Park Way Unit 4
- 5800 Lake Murray Blvd Unit 49
- 5800 Lake Murray Blvd Unit 83
- 5875 Lake Murray Blvd
- 5649 Lake Park Way Unit 101
- 5430 Baltimore Dr Unit 51
- 5430 Baltimore Dr Unit 70
- 5914 Dugan Ave
- 5707 Baltimore Dr Unit 12
- 5715 Baltimore Dr Unit 20
- 5715 Baltimore Dr Unit 86
- 5715 Baltimore Dr Unit 91
- 5583 Morro Way
- 5595 Morro Way
- 5579 Morro Way
- 5601 Morro Way
- 5586 Morro Way
- 5545 Morro Way
- 5545 Morro Way
- 5580 Morro Way
- 5590 Morro Way
- 5571 Morro Way
- 5600 Morro Way
- 5576 Morro Way
- 5611 Morro Way
- 8030 Morocco Dr
- 5610 Morro Way
- 5563 Morro Way
- 5621 Morro Way
- 8020 Morocco Dr
- 5590 Marengo Ave
- 5620 Morro Way
Your Personal Tour Guide
Ask me questions while you tour the home.