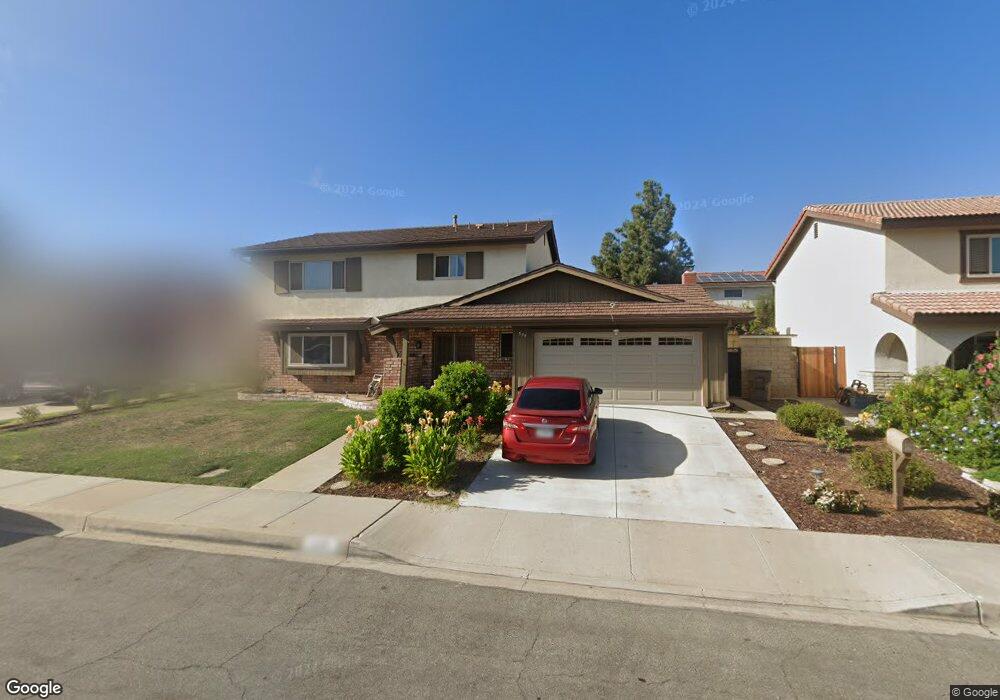
559 Corte Castano Camarillo, CA 93010
Estimated Value: $1,001,206 - $1,097,000
4
Beds
3
Baths
2,370
Sq Ft
$445/Sq Ft
Est. Value
About This Home
This home is located at 559 Corte Castano, Camarillo, CA 93010 and is currently estimated at $1,054,802, approximately $445 per square foot. 559 Corte Castano is a home located in Ventura County with nearby schools including Las Posas Elementary School, Monte Vista Middle School, and Camarillo Academy of Progressive Education.
Ownership History
Date
Name
Owned For
Owner Type
Purchase Details
Closed on
Apr 1, 2020
Sold by
Tapia Monica and Aguilera Alejandro Tapia
Bought by
Aguilera Alejandro Tapia and Tapia Monica
Current Estimated Value
Home Financials for this Owner
Home Financials are based on the most recent Mortgage that was taken out on this home.
Original Mortgage
$530,000
Outstanding Balance
$471,272
Interest Rate
3.6%
Mortgage Type
New Conventional
Estimated Equity
$583,530
Purchase Details
Closed on
Mar 10, 2016
Sold by
Hagedorn Gregg
Bought by
Tapia Alejandro and Tapia Monica
Home Financials for this Owner
Home Financials are based on the most recent Mortgage that was taken out on this home.
Original Mortgage
$535,713
Interest Rate
4.12%
Mortgage Type
FHA
Create a Home Valuation Report for This Property
The Home Valuation Report is an in-depth analysis detailing your home's value as well as a comparison with similar homes in the area
Home Values in the Area
Average Home Value in this Area
Purchase History
| Date | Buyer | Sale Price | Title Company |
|---|---|---|---|
| Aguilera Alejandro Tapia | -- | First American Title | |
| Tapia Alejandro | $585,000 | Equity Title Los Angeles |
Source: Public Records
Mortgage History
| Date | Status | Borrower | Loan Amount |
|---|---|---|---|
| Open | Aguilera Alejandro Tapia | $530,000 | |
| Closed | Tapia Alejandro | $535,713 |
Source: Public Records
Tax History Compared to Growth
Tax History
| Year | Tax Paid | Tax Assessment Tax Assessment Total Assessment is a certain percentage of the fair market value that is determined by local assessors to be the total taxable value of land and additions on the property. | Land | Improvement |
|---|---|---|---|---|
| 2025 | $7,605 | $692,515 | $450,433 | $242,082 |
| 2024 | $7,605 | $678,937 | $441,601 | $237,336 |
| 2023 | $7,332 | $665,625 | $432,942 | $232,683 |
| 2022 | $7,311 | $652,574 | $424,453 | $228,121 |
| 2021 | $7,049 | $639,779 | $416,130 | $223,649 |
| 2020 | $7,024 | $633,220 | $411,864 | $221,356 |
| 2019 | $6,992 | $620,805 | $403,789 | $217,016 |
| 2018 | $6,864 | $608,633 | $395,872 | $212,761 |
| 2017 | $6,460 | $596,700 | $388,110 | $208,590 |
| 2016 | $1,059 | $98,301 | $20,681 | $77,620 |
| 2015 | $1,047 | $96,826 | $20,371 | $76,455 |
| 2014 | $1,022 | $94,931 | $19,973 | $74,958 |
Source: Public Records
Map
Nearby Homes
- 1665 Avenida Soltura
- 858 Calle Portilla
- 800 Calle Higuera
- 1075 Seybolt Ave
- 1974 Sierra Mesa Dr
- 2048 Sierra Mesa Dr
- 860 Big Horn Ct
- 25 Encino Ave
- 51 Calle Escalon
- 174 Gardenia Ave
- 813 N Calle Circulo
- 61 Paseo Esplendido
- 73 Paseo Esplendido
- 1566 Edgemont Dr
- 106 Calle Bella Vista
- 1519 Lyndhurst Ave
- 124 Reddington Ct
- 35 Estaban Dr
- 405 Paseo Del Valle
- 166 Bramble Ct
- 575 Corte Castano
- 543 Corte Castano
- 1617 Avenida Del Manzano
- 591 Corte Castano
- 1631 Avenida Del Manzano
- 574 Corte Castano
- 525 Corte Castano
- 558 Corte Castano
- 1611 Avenida Del Manzano
- 590 Corte Castano
- 617 Corte Castano
- 542 Corte Castano
- 1639 Avenida Del Manzano
- 616 Corte Castano
- 1603 Avenida Del Manzano
- 1454 Calle la Cumbre
- 591 Calle Portilla
- 1624 Avenida Del Manzano
- 575 Calle Portilla
- 1442 Calle la Cumbre