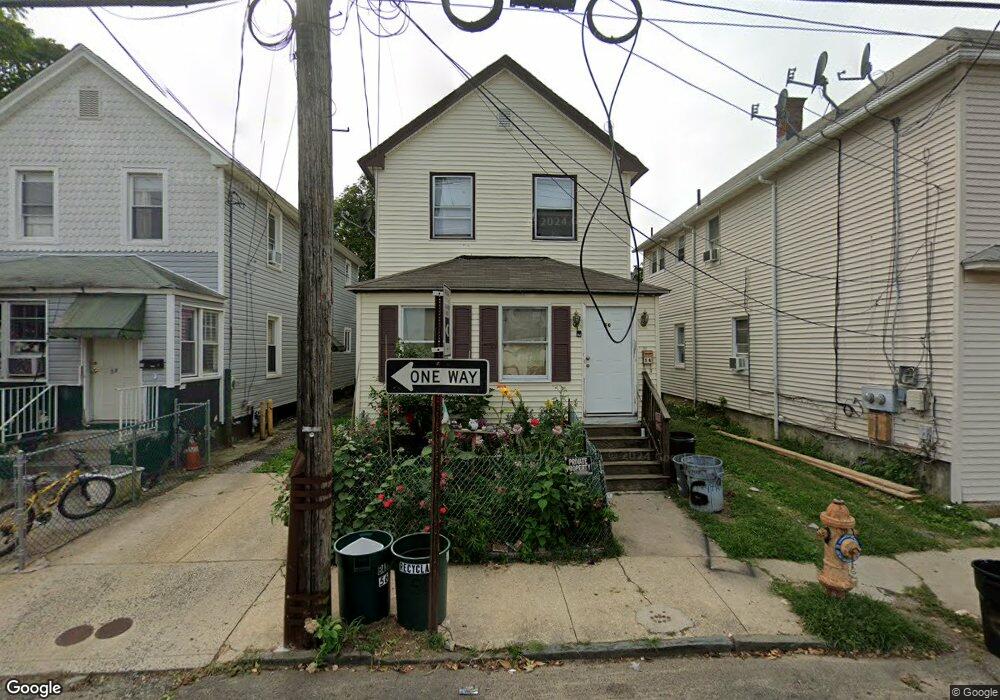
56 4th Ave Long Branch, NJ 07740
Estimated Value: $485,321 - $604,000
4
Beds
1
Bath
1,524
Sq Ft
$347/Sq Ft
Est. Value
About This Home
This home is located at 56 4th Ave, Long Branch, NJ 07740 and is currently estimated at $528,330, approximately $346 per square foot. 56 4th Ave is a home located in Monmouth County with nearby schools including Long Branch High School and Holy Trinity School.
Ownership History
Date
Name
Owned For
Owner Type
Purchase Details
Closed on
Dec 5, 2002
Sold by
Castro Jose
Bought by
Pelaez Catalino and Pelaez Pedro
Current Estimated Value
Home Financials for this Owner
Home Financials are based on the most recent Mortgage that was taken out on this home.
Original Mortgage
$175,000
Interest Rate
6.09%
Purchase Details
Closed on
Jun 20, 2001
Sold by
Melvin Quincy
Bought by
Castro Jose
Home Financials for this Owner
Home Financials are based on the most recent Mortgage that was taken out on this home.
Original Mortgage
$103,550
Interest Rate
7.14%
Purchase Details
Closed on
Jul 30, 1998
Sold by
Conover Mark
Bought by
Melvin Quincy and Melvin Annette
Home Financials for this Owner
Home Financials are based on the most recent Mortgage that was taken out on this home.
Original Mortgage
$86,700
Interest Rate
6.92%
Mortgage Type
VA
Create a Home Valuation Report for This Property
The Home Valuation Report is an in-depth analysis detailing your home's value as well as a comparison with similar homes in the area
Home Values in the Area
Average Home Value in this Area
Purchase History
| Date | Buyer | Sale Price | Title Company |
|---|---|---|---|
| Pelaez Catalino | $195,000 | -- | |
| Castro Jose | $109,000 | -- | |
| Melvin Quincy | $85,000 | -- |
Source: Public Records
Mortgage History
| Date | Status | Borrower | Loan Amount |
|---|---|---|---|
| Previous Owner | Pelaez Catalino | $175,000 | |
| Previous Owner | Castro Jose | $103,550 | |
| Previous Owner | Melvin Quincy | $86,700 |
Source: Public Records
Tax History
| Year | Tax Paid | Tax Assessment Tax Assessment Total Assessment is a certain percentage of the fair market value that is determined by local assessors to be the total taxable value of land and additions on the property. | Land | Improvement |
|---|---|---|---|---|
| 2025 | $6,123 | $440,900 | $238,700 | $202,200 |
| 2024 | $5,432 | $398,400 | $208,700 | $189,700 |
| 2023 | $5,432 | $349,800 | $168,700 | $181,100 |
| 2022 | $5,281 | $293,200 | $133,700 | $159,500 |
| 2021 | $5,281 | $263,900 | $114,700 | $149,200 |
| 2020 | $5,476 | $262,000 | $113,700 | $148,300 |
| 2019 | $5,152 | $245,100 | $103,700 | $141,400 |
| 2018 | $4,902 | $231,900 | $95,700 | $136,200 |
| 2017 | $4,481 | $217,400 | $83,700 | $133,700 |
| 2016 | $4,424 | $218,900 | $88,700 | $130,200 |
| 2015 | $4,768 | $214,100 | $89,900 | $124,200 |
| 2014 | $4,473 | $211,700 | $101,500 | $110,200 |
Source: Public Records
Map
Nearby Homes
- 167 Chelsea Ave
- 25 Community Place
- 40 N 5th Ave
- 168 Franklin Ave
- 170 Franklin Ave
- 162 Franklin Ave Unit 2
- 150 Franklin Ave Unit 5
- 395 Broadway
- 288 Morris Ave
- 171 2nd Ave
- 175 2nd Ave
- 237 3rd Ave Unit 1-4
- 117 Laurel St
- 139 Sixth Ave
- 40 University Dr
- 134 Lippincott Ave
- 20 Melrose Terrace Unit 407
- 20 Melrose Terrace Unit 408
- 30 Melrose Terrace Unit 208
- 30 Melrose Terrace Unit 609
Your Personal Tour Guide
Ask me questions while you tour the home.