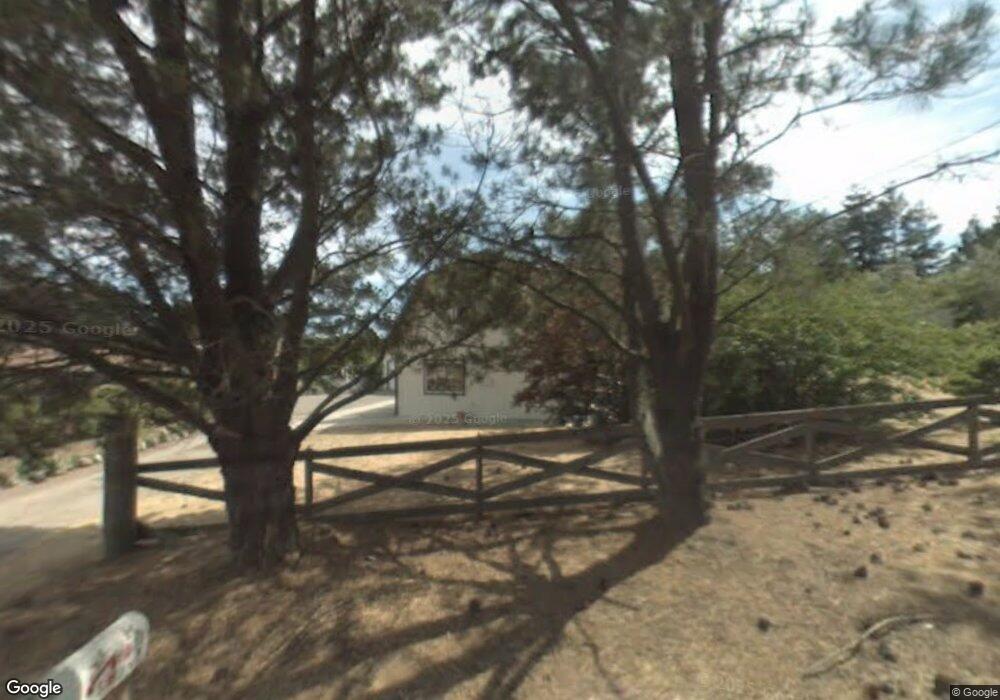
56 Balma Ln Petaluma, CA 94952
Estimated Value: $928,000 - $1,151,000
2
Beds
2
Baths
1,346
Sq Ft
$761/Sq Ft
Est. Value
About This Home
This home is located at 56 Balma Ln, Petaluma, CA 94952 and is currently estimated at $1,023,806, approximately $760 per square foot. 56 Balma Ln is a home located in Sonoma County with nearby schools including Dunham Elementary School, Petaluma Junior High School, and Petaluma High School.
Ownership History
Date
Name
Owned For
Owner Type
Purchase Details
Closed on
Oct 7, 2010
Sold by
Netz Catherine M
Bought by
Netz Catherine M
Current Estimated Value
Home Financials for this Owner
Home Financials are based on the most recent Mortgage that was taken out on this home.
Original Mortgage
$270,000
Interest Rate
4.26%
Mortgage Type
New Conventional
Purchase Details
Closed on
Feb 24, 2003
Sold by
Netz Catherine M
Bought by
Netz Catherine M
Purchase Details
Closed on
Aug 6, 1998
Sold by
Netz Catherine M
Bought by
Netz Catherine M
Purchase Details
Closed on
Sep 26, 1994
Sold by
Netz Catherine M
Bought by
Netz Catherine M
Home Financials for this Owner
Home Financials are based on the most recent Mortgage that was taken out on this home.
Original Mortgage
$53,445
Interest Rate
8.58%
Mortgage Type
Construction
Create a Home Valuation Report for This Property
The Home Valuation Report is an in-depth analysis detailing your home's value as well as a comparison with similar homes in the area
Home Values in the Area
Average Home Value in this Area
Purchase History
| Date | Buyer | Sale Price | Title Company |
|---|---|---|---|
| Netz Catherine M | -- | Pacific Coast Title Company | |
| Netz Catherine M | -- | Pacific Coast Title Company | |
| Netz Catherine M | -- | -- | |
| Netz Catherine M | -- | California Land Title Co | |
| Netz Catherine M | -- | First American Title | |
| Netz Catherine M | -- | First American Title |
Source: Public Records
Mortgage History
| Date | Status | Borrower | Loan Amount |
|---|---|---|---|
| Closed | Netz Catherine M | $270,000 | |
| Closed | Netz Catherine M | $53,445 |
Source: Public Records
Tax History Compared to Growth
Tax History
| Year | Tax Paid | Tax Assessment Tax Assessment Total Assessment is a certain percentage of the fair market value that is determined by local assessors to be the total taxable value of land and additions on the property. | Land | Improvement |
|---|---|---|---|---|
| 2025 | $4,332 | $385,804 | $118,263 | $267,541 |
| 2024 | $4,332 | $378,241 | $115,945 | $262,296 |
| 2023 | $4,332 | $370,825 | $113,672 | $257,153 |
| 2022 | $4,205 | $363,555 | $111,444 | $252,111 |
| 2021 | $4,107 | $356,427 | $109,259 | $247,168 |
| 2020 | $4,129 | $352,773 | $108,139 | $244,634 |
| 2019 | $4,064 | $345,857 | $106,019 | $239,838 |
| 2018 | $3,777 | $339,077 | $103,941 | $235,136 |
| 2017 | $3,713 | $332,429 | $101,903 | $230,526 |
| 2016 | $3,588 | $325,911 | $99,905 | $226,006 |
| 2015 | $3,500 | $321,017 | $98,405 | $222,612 |
| 2014 | $3,456 | $314,730 | $96,478 | $218,252 |
Source: Public Records
Map
Nearby Homes
- 2705 Roblar Rd
- 9053 Water Rd
- 130 Jewett Rd
- 239 Live Oak Dr
- 8704 Cypress Ave
- 9123 Red Hill Ct
- 8776 Logan Place
- 750 W School St
- 21 Valen Way
- 377 Maple Ave
- 411 Highland Ave
- 218 W Cotati Ave
- 95 Jagla St
- 152 Valparaiso Ave
- 1355 Rose Ave
- 11 Ramble Creek Dr
- 220 Mendelssohn Ct
- 79 William St Unit L
- 7080 Gravenstein Hwy
- 6675 Petersen Rd