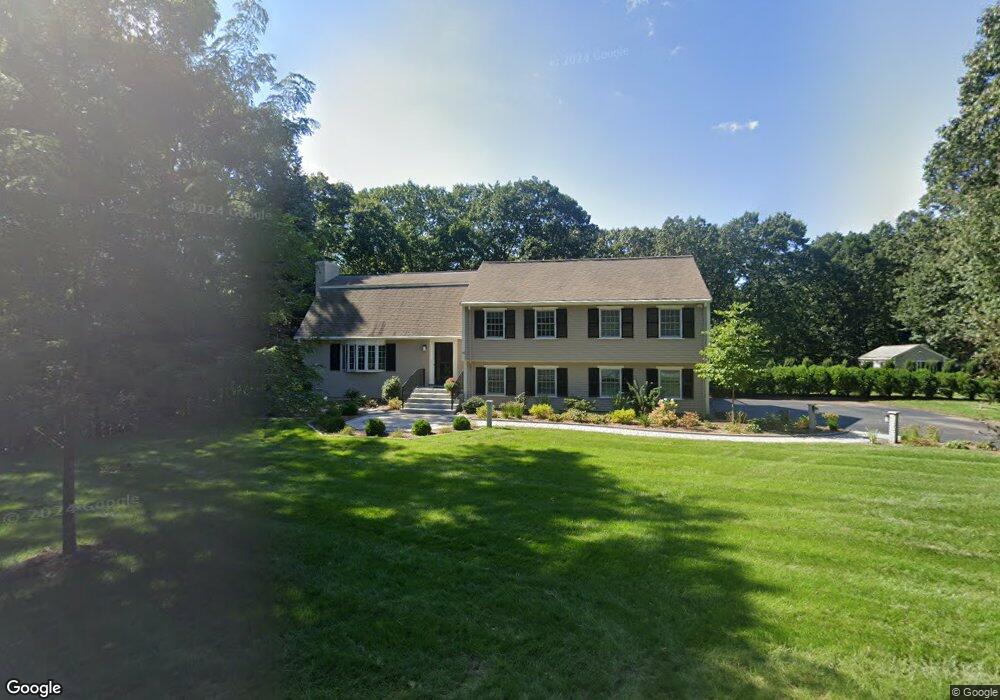
56 Birch Rd Andover, MA 01810
West Andover NeighborhoodEstimated Value: $1,154,000 - $1,800,000
5
Beds
4
Baths
3,853
Sq Ft
$360/Sq Ft
Est. Value
About This Home
This home is located at 56 Birch Rd, Andover, MA 01810 and is currently estimated at $1,385,279, approximately $359 per square foot. 56 Birch Rd is a home located in Essex County with nearby schools including West Elementary School, Andover West Middle School, and Andover High School.
Ownership History
Date
Name
Owned For
Owner Type
Purchase Details
Closed on
Oct 23, 2019
Sold by
Denison Birch Road Rt
Bought by
Denison Ft
Current Estimated Value
Purchase Details
Closed on
Apr 27, 2004
Sold by
Denison Maureen L
Bought by
Denison Tr John C and Denison Maureen L
Purchase Details
Closed on
Aug 21, 1992
Sold by
Rotondi A Joseph
Bought by
Denison Maureen L
Create a Home Valuation Report for This Property
The Home Valuation Report is an in-depth analysis detailing your home's value as well as a comparison with similar homes in the area
Home Values in the Area
Average Home Value in this Area
Purchase History
| Date | Buyer | Sale Price | Title Company |
|---|---|---|---|
| Denison Ft | -- | -- | |
| Denison Tr John C | -- | -- | |
| Denison Maureen L | $320,000 | -- |
Source: Public Records
Mortgage History
| Date | Status | Borrower | Loan Amount |
|---|---|---|---|
| Previous Owner | Denison Maureen L | $100,000 | |
| Previous Owner | Denison Maureen L | $150,000 | |
| Previous Owner | Denison Maureen L | $150,000 |
Source: Public Records
Tax History
| Year | Tax Paid | Tax Assessment Tax Assessment Total Assessment is a certain percentage of the fair market value that is determined by local assessors to be the total taxable value of land and additions on the property. | Land | Improvement |
|---|---|---|---|---|
| 2024 | $13,507 | $1,048,700 | $596,200 | $452,500 |
| 2023 | $12,999 | $951,600 | $537,800 | $413,800 |
| 2022 | $11,931 | $817,200 | $469,000 | $348,200 |
| 2021 | $11,425 | $747,200 | $427,200 | $320,000 |
| 2020 | $10,960 | $730,200 | $417,200 | $313,000 |
| 2019 | $10,298 | $674,400 | $381,900 | $292,500 |
| 2018 | $9,960 | $636,800 | $367,500 | $269,300 |
| 2017 | $9,525 | $627,500 | $360,500 | $267,000 |
| 2016 | $9,300 | $627,500 | $360,500 | $267,000 |
| 2015 | $8,967 | $599,000 | $347,000 | $252,000 |
Source: Public Records
Map
Nearby Homes
- 54 Birch Rd
- 6 Exeter Way
- 20 Robert Dr Unit 20
- 31 Crenshaw Ln Unit 31
- 37 Crenshaw Ln Unit 37
- 241 Lowell St Unit 3
- 22 Bobby Jones Dr
- 25 Clubview Dr Unit 25
- 40 Chandler Cir
- 58 Chandler Rd
- 21 Clubview Dr Unit 21
- 30 Canterbury St
- 4 Weeping Willow Dr
- 5 Weeping Willow Dr
- 2 Weeping Willow Dr
- 29 Westchester Dr
- 11 Rennie Dr
- 9 Oakland Rd
- 53 Martingale Ln
- 5 Crestwood Cir
Your Personal Tour Guide
Ask me questions while you tour the home.