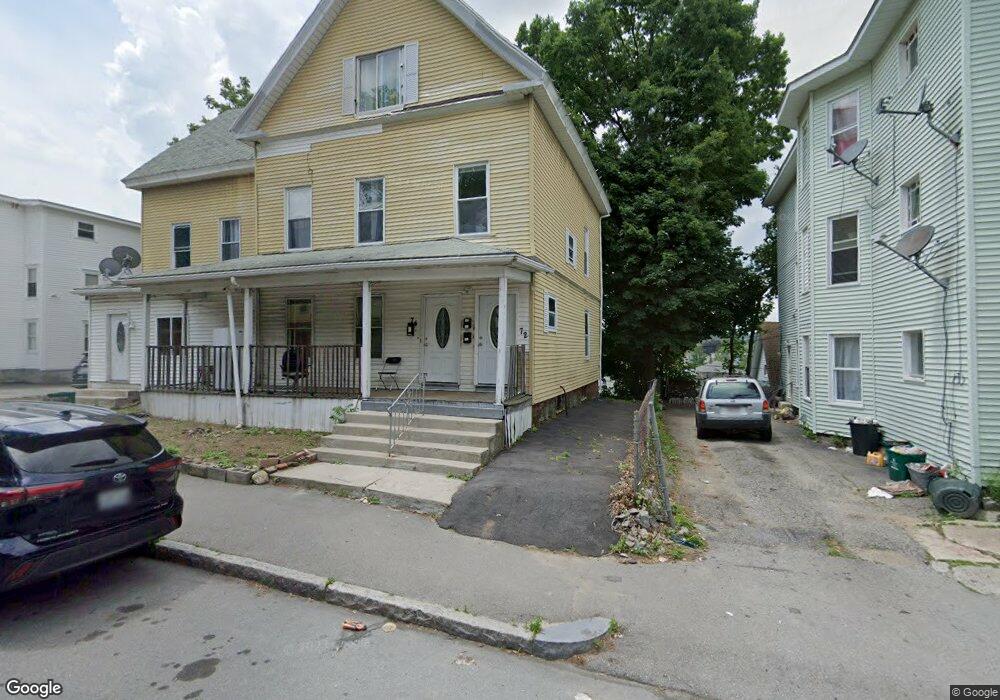
56 May St Worcester, MA 01610
University Park NeighborhoodEstimated Value: $232,000 - $599,000
Studio
--
Bath
--
Sq Ft
9,278
Sq Ft Lot
About This Home
This home is located at 56 May St, Worcester, MA 01610 and is currently estimated at $338,997. 56 May St is a home located in Worcester County with nearby schools including Jacob Hiatt Magnet School, Chandler Magnet, and Woodland Academy.
Ownership History
Date
Name
Owned For
Owner Type
Purchase Details
Closed on
Oct 30, 2018
Sold by
Buckingham Development
Bought by
May Enterprises Llc
Current Estimated Value
Purchase Details
Closed on
Apr 28, 2006
Sold by
May Street Prop Llc
Bought by
Buckingham Dev Llc
Purchase Details
Closed on
Nov 8, 2005
Sold by
Wong Ser Shin and Huang Yixiang
Bought by
May St Prop Llc
Home Financials for this Owner
Home Financials are based on the most recent Mortgage that was taken out on this home.
Original Mortgage
$82,500
Interest Rate
5.85%
Mortgage Type
Purchase Money Mortgage
Purchase Details
Closed on
Oct 11, 1995
Sold by
Israel Leonard
Bought by
Huang Yixiang and Wong Ser
Create a Home Valuation Report for This Property
The Home Valuation Report is an in-depth analysis detailing your home's value as well as a comparison with similar homes in the area
Home Values in the Area
Average Home Value in this Area
Purchase History
| Date | Buyer | Sale Price | Title Company |
|---|---|---|---|
| May Enterprises Llc | -- | -- | |
| Buckingham Dev Llc | $135,000 | -- | |
| May St Prop Llc | $110,000 | -- | |
| Huang Yixiang | $12,800 | -- |
Source: Public Records
Mortgage History
| Date | Status | Borrower | Loan Amount |
|---|---|---|---|
| Previous Owner | May St Prop Llc | $82,500 |
Source: Public Records
Tax History
| Year | Tax Paid | Tax Assessment Tax Assessment Total Assessment is a certain percentage of the fair market value that is determined by local assessors to be the total taxable value of land and additions on the property. | Land | Improvement |
|---|---|---|---|---|
| 2025 | $1,297 | $98,300 | $98,300 | $0 |
| 2024 | $1,352 | $98,300 | $98,300 | $0 |
| 2023 | $1,226 | $85,500 | $85,500 | $0 |
| 2022 | $1,040 | $68,400 | $68,400 | $0 |
| 2021 | $891 | $54,700 | $54,700 | $0 |
| 2020 | $923 | $54,300 | $54,300 | $0 |
| 2019 | $855 | $47,500 | $47,500 | $0 |
| 2018 | $898 | $47,500 | $47,500 | $0 |
| 2017 | $913 | $47,500 | $47,500 | $0 |
| 2016 | $697 | $33,800 | $33,800 | $0 |
| 2015 | $678 | $33,800 | $33,800 | $0 |
| 2014 | $660 | $33,800 | $33,800 | $0 |
Source: Public Records
Map
Nearby Homes
Your Personal Tour Guide
Ask me questions while you tour the home.