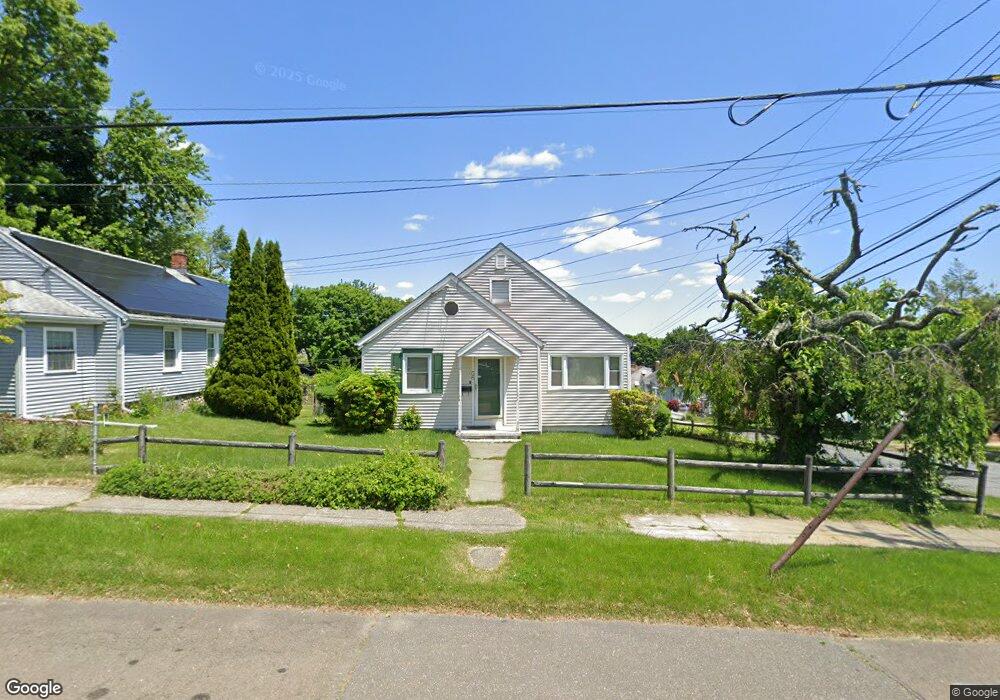
56 Peet St Bridgeport, CT 06606
North End NeighborhoodEstimated Value: $366,000 - $416,000
3
Beds
2
Baths
1,163
Sq Ft
$342/Sq Ft
Est. Value
About This Home
This home is located at 56 Peet St, Bridgeport, CT 06606 and is currently estimated at $397,555, approximately $341 per square foot. 56 Peet St is a home located in Fairfield County with nearby schools including Blackham School, Central High School, and The Unquowa School.
Ownership History
Date
Name
Owned For
Owner Type
Purchase Details
Closed on
Oct 1, 2008
Sold by
Fitzgerald Paul K
Bought by
Pauleman John and Pierre Nerlande
Current Estimated Value
Home Financials for this Owner
Home Financials are based on the most recent Mortgage that was taken out on this home.
Original Mortgage
$186,996
Outstanding Balance
$125,003
Interest Rate
6.54%
Estimated Equity
$272,552
Create a Home Valuation Report for This Property
The Home Valuation Report is an in-depth analysis detailing your home's value as well as a comparison with similar homes in the area
Home Values in the Area
Average Home Value in this Area
Purchase History
| Date | Buyer | Sale Price | Title Company |
|---|---|---|---|
| Pauleman John | $189,000 | -- | |
| Pauleman John | $189,000 | -- |
Source: Public Records
Mortgage History
| Date | Status | Borrower | Loan Amount |
|---|---|---|---|
| Open | Pauleman John | $186,996 | |
| Closed | Pauleman John | $186,996 | |
| Previous Owner | Pauleman John | $99,000 |
Source: Public Records
Tax History
| Year | Tax Paid | Tax Assessment Tax Assessment Total Assessment is a certain percentage of the fair market value that is determined by local assessors to be the total taxable value of land and additions on the property. | Land | Improvement |
|---|---|---|---|---|
| 2025 | $6,438 | $148,170 | $75,310 | $72,860 |
| 2024 | $6,438 | $148,170 | $75,310 | $72,860 |
| 2023 | $6,438 | $148,170 | $75,310 | $72,860 |
| 2022 | $6,438 | $148,170 | $75,310 | $72,860 |
| 2021 | $6,438 | $148,170 | $75,310 | $72,860 |
| 2020 | $5,618 | $104,050 | $43,270 | $60,780 |
| 2019 | $5,618 | $104,050 | $43,270 | $60,780 |
| 2018 | $5,657 | $104,050 | $43,270 | $60,780 |
| 2017 | $5,657 | $104,050 | $43,270 | $60,780 |
| 2016 | $5,657 | $104,050 | $43,270 | $60,780 |
| 2015 | $5,566 | $131,890 | $49,980 | $81,910 |
| 2014 | $5,566 | $131,890 | $49,980 | $81,910 |
Source: Public Records
Map
Nearby Homes
- 574 Thorme St
- 604 Birmingham St
- 625 Clark St
- 26 Marsdale Ave
- 375 Ruth St
- 619 Queen St
- 525 Westfield Ave
- 120 Clark St
- 339 Goldenrod Ave
- 234 Savoy St
- 405 Westfield Ave
- 316 Goldenrod Ave
- 671 Fairview Ave
- 720 Queen St
- 631 Fairview Ave
- 260 Toilsome Place
- 3461 Main St
- 932 Thorme St
- 1095 Wayne St
- 105 Tremont Ave Unit E
Your Personal Tour Guide
Ask me questions while you tour the home.