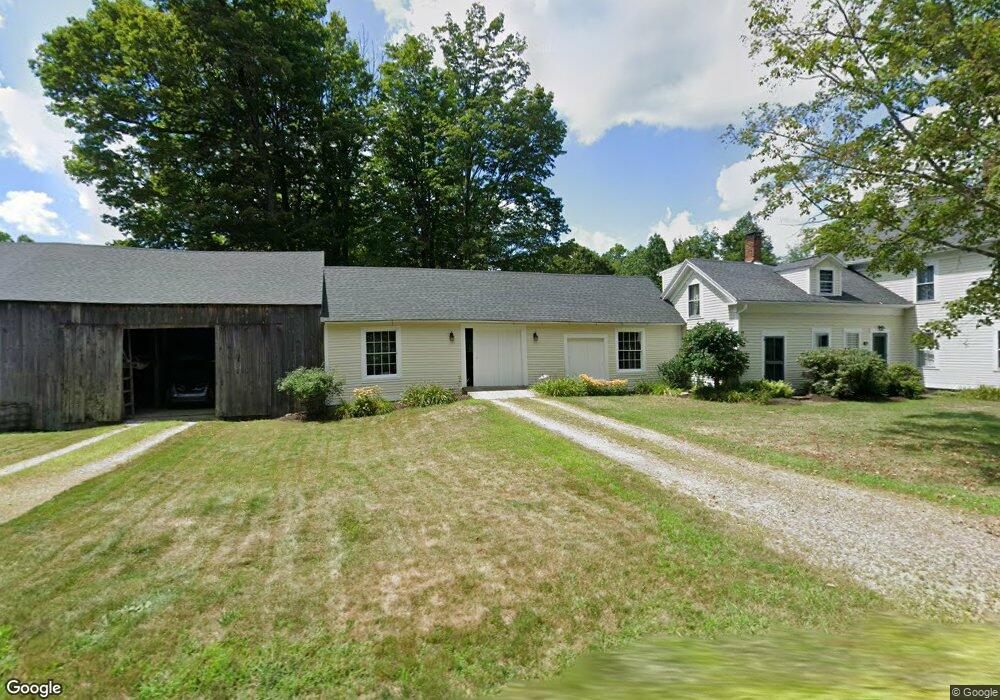
56 S Main St New Salem, MA 01355
New Salem NeighborhoodEstimated Value: $383,384 - $475,000
4
Beds
2
Baths
2,072
Sq Ft
$212/Sq Ft
Est. Value
About This Home
This home is located at 56 S Main St, New Salem, MA 01355 and is currently estimated at $439,096, approximately $211 per square foot. 56 S Main St is a home located in Franklin County with nearby schools including Swift River School and Ralph C Mahar Regional School.
Ownership History
Date
Name
Owned For
Owner Type
Purchase Details
Closed on
Oct 31, 1997
Sold by
Spencer Priscilla A and Spencer Priscilla M
Bought by
Lafley William G and Noyes Gladys Kimberley
Current Estimated Value
Home Financials for this Owner
Home Financials are based on the most recent Mortgage that was taken out on this home.
Original Mortgage
$37,000
Outstanding Balance
$6,088
Interest Rate
7.31%
Mortgage Type
Purchase Money Mortgage
Estimated Equity
$433,008
Create a Home Valuation Report for This Property
The Home Valuation Report is an in-depth analysis detailing your home's value as well as a comparison with similar homes in the area
Home Values in the Area
Average Home Value in this Area
Purchase History
| Date | Buyer | Sale Price | Title Company |
|---|---|---|---|
| Lafley William G | $143,500 | -- |
Source: Public Records
Mortgage History
| Date | Status | Borrower | Loan Amount |
|---|---|---|---|
| Open | Lafley William G | $37,000 | |
| Previous Owner | Lafley William G | $15,000 |
Source: Public Records
Tax History Compared to Growth
Tax History
| Year | Tax Paid | Tax Assessment Tax Assessment Total Assessment is a certain percentage of the fair market value that is determined by local assessors to be the total taxable value of land and additions on the property. | Land | Improvement |
|---|---|---|---|---|
| 2025 | $4,203 | $309,500 | $86,300 | $223,200 |
| 2024 | $3,992 | $277,800 | $74,000 | $203,800 |
| 2023 | $4,095 | $266,800 | $62,700 | $204,100 |
| 2022 | $4,265 | $225,400 | $62,700 | $162,700 |
| 2021 | $4,050 | $206,300 | $57,200 | $149,100 |
| 2020 | $3,722 | $206,300 | $57,200 | $149,100 |
| 2019 | $16 | $206,300 | $57,200 | $149,100 |
| 2018 | $7,380 | $198,500 | $55,400 | $143,100 |
| 2017 | $7,080 | $189,800 | $52,800 | $137,000 |
| 2016 | $3,270 | $189,800 | $52,800 | $137,000 |
| 2015 | $3,228 | $195,900 | $55,900 | $140,000 |
Source: Public Records
Map
Nearby Homes
- 72 N Main St
- 0 Wendell Rd
- Lot 55 Wendell Rd
- 63 Cooleyville Rd
- 0 Cooleyville Rd
- 2 Fay Rd
- Back Lot 0 Petersham Rd
- Lot 31 Wendell Rd
- 0 S Main St
- 28 Morse Village Rd
- 120 Horton Rd
- 4 West St
- 610 S Main St
- 270 Holtshire Rd
- 84 Lake Dr
- 0 Shore Dr
- 85 Lake Dr
- 36 Merrill Dr
- 133 Lakeview Rd
- 248 Holtshire Rd Unit Lot 2