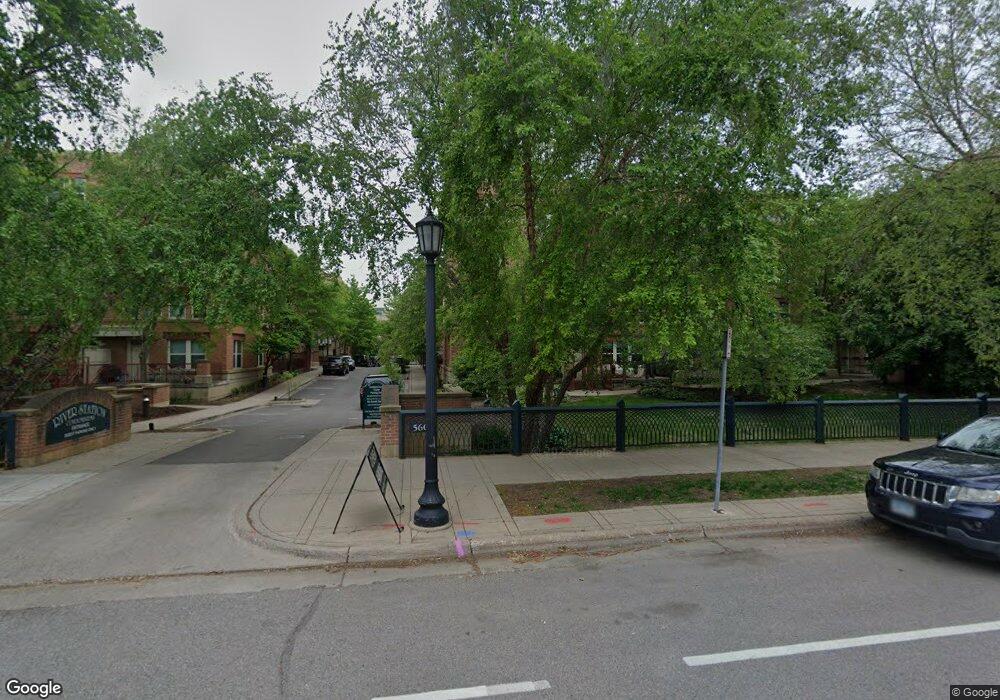
560 N 2nd St Unit 305 Minneapolis, MN 55401
North Loop NeighborhoodEstimated Value: $280,000 - $312,000
2
Beds
1
Bath
896
Sq Ft
$324/Sq Ft
Est. Value
About This Home
This home is located at 560 N 2nd St Unit 305, Minneapolis, MN 55401 and is currently estimated at $290,422, approximately $324 per square foot. 560 N 2nd St Unit 305 is a home located in Hennepin County with nearby schools including Webster Elementary, Northeast Middle School, and Thomas Edison High School.
Ownership History
Date
Name
Owned For
Owner Type
Purchase Details
Closed on
Mar 11, 2021
Sold by
Horta Erika S and Cossens William R
Bought by
Menard Nicole
Current Estimated Value
Home Financials for this Owner
Home Financials are based on the most recent Mortgage that was taken out on this home.
Original Mortgage
$212,000
Outstanding Balance
$192,278
Interest Rate
2.73%
Mortgage Type
New Conventional
Estimated Equity
$112,265
Purchase Details
Closed on
Jun 5, 2014
Sold by
Martin Robert P and Martin Jennifer E
Bought by
Horta Erika S
Home Financials for this Owner
Home Financials are based on the most recent Mortgage that was taken out on this home.
Original Mortgage
$162,400
Interest Rate
4.28%
Mortgage Type
New Conventional
Purchase Details
Closed on
Jul 2, 2003
Sold by
Pearson Peter D
Bought by
Martin Robert P
Purchase Details
Closed on
Dec 14, 2001
Sold by
Heritage Renovations Llc
Bought by
Pearson Peter D and Pearson Mary Ann
Create a Home Valuation Report for This Property
The Home Valuation Report is an in-depth analysis detailing your home's value as well as a comparison with similar homes in the area
Home Values in the Area
Average Home Value in this Area
Purchase History
| Date | Buyer | Sale Price | Title Company |
|---|---|---|---|
| Menard Nicole | $265,000 | Edina Realty Title Inc | |
| Horta Erika S | $203,000 | Trademark Title Services Inc | |
| Martin Robert P | $212,500 | -- | |
| Pearson Peter D | $184,017 | -- | |
| Menard Nicole Nicole | $265,000 | -- |
Source: Public Records
Mortgage History
| Date | Status | Borrower | Loan Amount |
|---|---|---|---|
| Open | Menard Nicole | $212,000 | |
| Previous Owner | Horta Erika S | $162,400 | |
| Closed | Menard Nicole Nicole | $212,000 |
Source: Public Records
Tax History Compared to Growth
Tax History
| Year | Tax Paid | Tax Assessment Tax Assessment Total Assessment is a certain percentage of the fair market value that is determined by local assessors to be the total taxable value of land and additions on the property. | Land | Improvement |
|---|---|---|---|---|
| 2023 | $3,287 | $264,000 | $80,000 | $184,000 |
| 2022 | $3,370 | $256,000 | $73,000 | $183,000 |
| 2021 | $3,184 | $256,000 | $64,000 | $192,000 |
| 2020 | $3,452 | $251,000 | $44,800 | $206,200 |
| 2019 | $3,294 | $251,000 | $22,400 | $228,600 |
| 2018 | $3,058 | $234,500 | $22,400 | $212,100 |
| 2017 | $2,922 | $206,000 | $22,400 | $183,600 |
| 2016 | $2,771 | $191,500 | $22,400 | $169,100 |
| 2015 | $2,847 | $170,500 | $22,400 | $148,100 |
| 2014 | -- | $147,000 | $22,400 | $124,600 |
Source: Public Records
Map
Nearby Homes
- 615 N 1st St Unit 405
- 575 N 1st St Unit 123
- 645 N 1st St Unit 141
- 645 N 1st St Unit 411
- 645 N 1st St Unit 305
- 580 N 2nd St Unit 407
- 560 N 2nd St Unit 114
- 560 N 2nd St Unit 408
- 660 N 2nd St Unit 104
- 545 N 1st St Unit 400
- 545 N 1st St Unit 125
- 702 N 1st St Unit 521
- 702 N 1st St Unit 321
- 517 River St
- 408 N 1st St Unit 310
- 700 Washington Ave N Unit 203
- 700 Washington Ave N Unit 210
- 700 Washington Ave N Unit 207
- 700 Washington Ave N Unit 601
- 700 Washington Ave N Unit 615
- 560 N 2nd St Unit 134
- 560 N 2nd St Unit 412
- 560 N 2nd St Unit 411
- 560 N 2nd St Unit 410
- 560 N 2nd St Unit 409
- 560 N 2nd St Unit 407
- 560 N 2nd St Unit 406
- 560 N 2nd St Unit 405
- 560 N 2nd St Unit 404
- 560 N 2nd St Unit 403
- 560 N 2nd St Unit 402
- 560 N 2nd St Unit 401
- 560 N 2nd St Unit 400
- 560 N 2nd St Unit 306
- 560 N 2nd St Unit 304
- 560 N 2nd St Unit 303
- 560 N 2nd St Unit 302
- 560 N 2nd St Unit 301
- 560 N 2nd St Unit 300
- 560 N 2nd St Unit 140