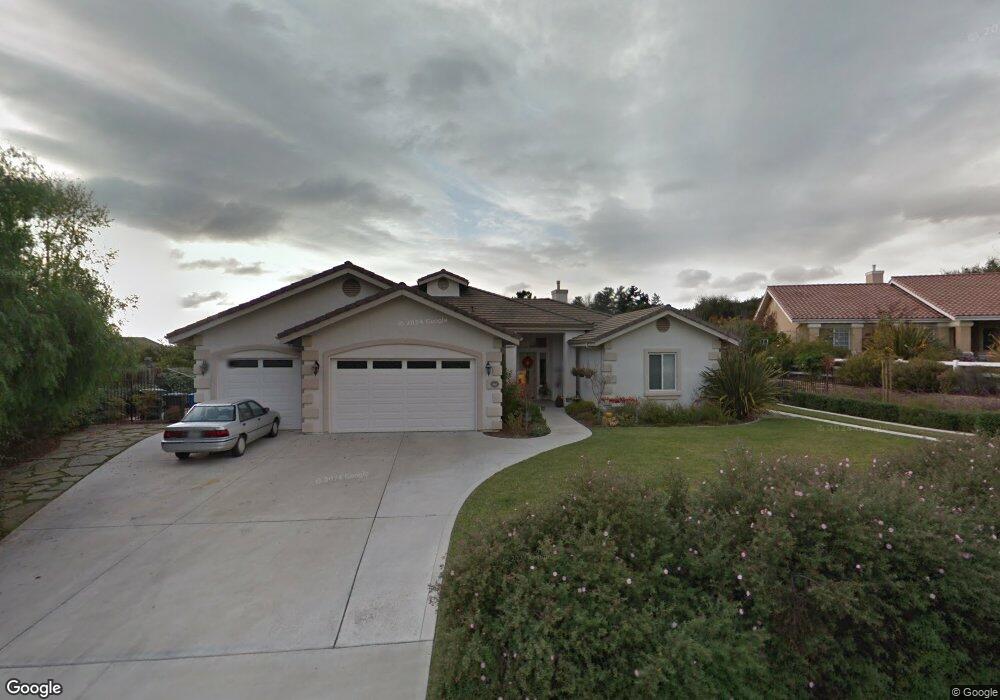
560 Sandra Ct Nipomo, CA 93444
Estimated Value: $1,120,000 - $1,300,000
4
Beds
3
Baths
2,602
Sq Ft
$466/Sq Ft
Est. Value
About This Home
This home is located at 560 Sandra Ct, Nipomo, CA 93444 and is currently estimated at $1,211,577, approximately $465 per square foot. 560 Sandra Ct is a home located in San Luis Obispo County with nearby schools including Dana Elementary School, Mesa Middle School, and Nipomo High School.
Ownership History
Date
Name
Owned For
Owner Type
Purchase Details
Closed on
Oct 21, 2024
Sold by
Owen Douglas E and Owen Susan J
Bought by
Douglas And Susan Owen Family Trust and Owen
Current Estimated Value
Purchase Details
Closed on
Apr 9, 2004
Sold by
Richard Deblauw Construction Co
Bought by
Owen Douglas E and Owen Susan J
Home Financials for this Owner
Home Financials are based on the most recent Mortgage that was taken out on this home.
Original Mortgage
$460,000
Interest Rate
5.25%
Mortgage Type
Purchase Money Mortgage
Create a Home Valuation Report for This Property
The Home Valuation Report is an in-depth analysis detailing your home's value as well as a comparison with similar homes in the area
Home Values in the Area
Average Home Value in this Area
Purchase History
| Date | Buyer | Sale Price | Title Company |
|---|---|---|---|
| Douglas And Susan Owen Family Trust | -- | None Listed On Document | |
| Owen Douglas E | $639,000 | Fidelity Title Company |
Source: Public Records
Mortgage History
| Date | Status | Borrower | Loan Amount |
|---|---|---|---|
| Previous Owner | Owen Douglas E | $460,000 |
Source: Public Records
Tax History
| Year | Tax Paid | Tax Assessment Tax Assessment Total Assessment is a certain percentage of the fair market value that is determined by local assessors to be the total taxable value of land and additions on the property. | Land | Improvement |
|---|---|---|---|---|
| 2025 | $9,544 | $934,993 | $369,658 | $565,335 |
| 2024 | $9,433 | $916,660 | $362,410 | $554,250 |
| 2023 | $9,433 | $898,687 | $355,304 | $543,383 |
| 2022 | $9,289 | $881,067 | $348,338 | $532,729 |
| 2021 | $9,271 | $863,792 | $341,508 | $522,284 |
| 2020 | $9,164 | $854,936 | $338,007 | $516,929 |
| 2019 | $9,106 | $838,174 | $331,380 | $506,794 |
| 2018 | $8,996 | $821,740 | $324,883 | $496,857 |
| 2017 | $8,826 | $805,628 | $318,513 | $487,115 |
| 2016 | $8,208 | $779,000 | $310,000 | $469,000 |
| 2015 | $7,277 | $691,000 | $275,000 | $416,000 |
| 2014 | $6,823 | $660,000 | $255,000 | $405,000 |
Source: Public Records
Map
Nearby Homes
- 770 & 772 Beverly
- 182 172 E Chestnut
- 680 Sweet Donna Place
- 1089 Olympic Way
- 219 Lema Dr
- 745 Inga Rd
- 850 Primrose Ln
- 228 Chaparral Ln
- 778 Primrose Ln
- 760 Black Oak Ln
- 719 W Tefft St
- 940 Calle Fresa
- 270 S Tejas Place
- 680 Hill St
- 250 Via Promesa
- 325 Black Hawk Way
- 345 Black Hawk Way
- 375 Kestrel Way
- 160 San Antonio Ln
- 1093 Camino Caballo
Your Personal Tour Guide
Ask me questions while you tour the home.