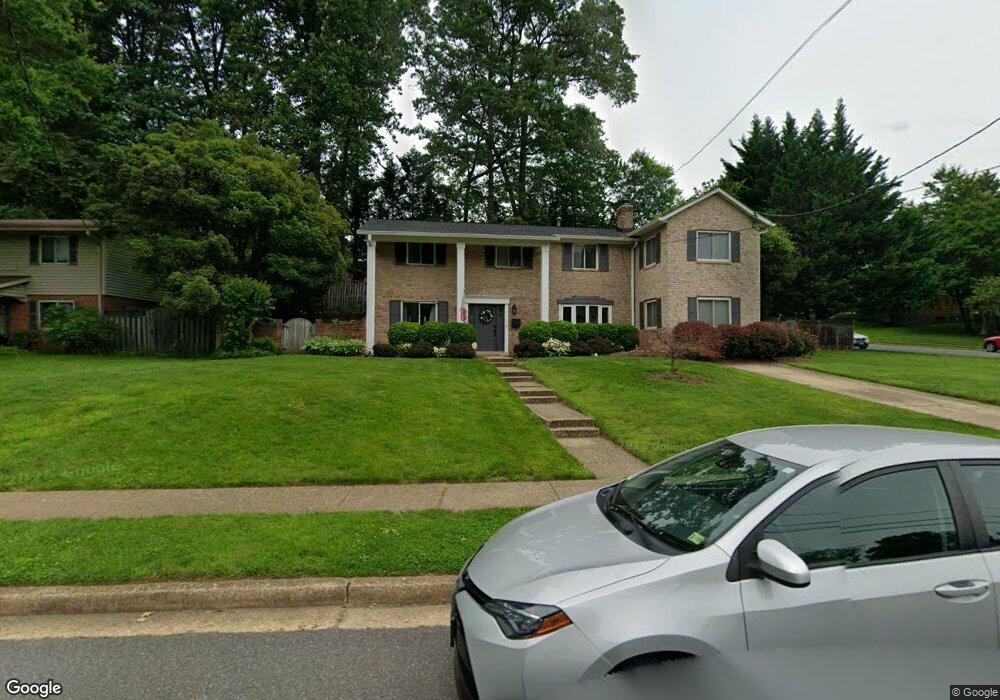
5600 Eastbourne Dr Springfield, VA 22151
Estimated Value: $785,000 - $867,039
4
Beds
4
Baths
2,860
Sq Ft
$286/Sq Ft
Est. Value
About This Home
This home is located at 5600 Eastbourne Dr, Springfield, VA 22151 and is currently estimated at $818,510, approximately $286 per square foot. 5600 Eastbourne Dr is a home located in Fairfax County with nearby schools including Kings Park Elementary School, Kings Glen Elementary School, and Lake Braddock Secondary School.
Ownership History
Date
Name
Owned For
Owner Type
Purchase Details
Closed on
May 27, 2022
Sold by
Chounramany Queener Omekham
Bought by
Omekham Chounramany Queener Revocable Trust
Current Estimated Value
Purchase Details
Closed on
Oct 20, 2016
Sold by
Queener Omekham C and Queener Mark Edward
Bought by
Queener Omekham C
Home Financials for this Owner
Home Financials are based on the most recent Mortgage that was taken out on this home.
Original Mortgage
$390,000
Interest Rate
3.48%
Mortgage Type
New Conventional
Purchase Details
Closed on
Mar 28, 1997
Sold by
Carson William D and Carson Shirley M
Bought by
Queener Mark E
Home Financials for this Owner
Home Financials are based on the most recent Mortgage that was taken out on this home.
Original Mortgage
$150,400
Interest Rate
7.59%
Mortgage Type
New Conventional
Create a Home Valuation Report for This Property
The Home Valuation Report is an in-depth analysis detailing your home's value as well as a comparison with similar homes in the area
Home Values in the Area
Average Home Value in this Area
Purchase History
| Date | Buyer | Sale Price | Title Company |
|---|---|---|---|
| Omekham Chounramany Queener Revocable Trust | $695,500 | Bergstrom Attorneys Pllc | |
| Queener Omekham C | -- | None Available | |
| Queener Mark E | $188,000 | -- |
Source: Public Records
Mortgage History
| Date | Status | Borrower | Loan Amount |
|---|---|---|---|
| Previous Owner | Queener Omekham C | $390,000 | |
| Previous Owner | Queener Mark E | $150,400 |
Source: Public Records
Tax History Compared to Growth
Tax History
| Year | Tax Paid | Tax Assessment Tax Assessment Total Assessment is a certain percentage of the fair market value that is determined by local assessors to be the total taxable value of land and additions on the property. | Land | Improvement |
|---|---|---|---|---|
| 2025 | $8,439 | $799,560 | $312,000 | $487,560 |
| 2024 | $8,439 | $728,440 | $277,000 | $451,440 |
| 2023 | $7,963 | $705,640 | $277,000 | $428,640 |
| 2022 | $7,953 | $695,500 | $272,000 | $423,500 |
| 2021 | $7,064 | $601,930 | $242,000 | $359,930 |
| 2020 | $6,824 | $576,560 | $237,000 | $339,560 |
| 2019 | $6,574 | $555,500 | $229,000 | $326,500 |
| 2018 | $6,104 | $530,820 | $210,000 | $320,820 |
| 2017 | $5,857 | $504,480 | $196,000 | $308,480 |
| 2016 | $5,844 | $504,480 | $196,000 | $308,480 |
| 2015 | $5,518 | $494,430 | $192,000 | $302,430 |
| 2014 | $5,189 | $465,970 | $182,000 | $283,970 |
Source: Public Records
Map
Nearby Homes
- 5511 Callander Dr
- 5639 Fort Corloran Dr
- 5823 Royal Ridge Dr Unit S
- 5809 Royal Ridge Dr Unit I
- 5801 Boothe Dr
- 8530 Barrington Ct Unit 938
- 5800 Torington Dr Unit 836
- 5816 Torington Dr Unit 860
- 8519 Westover Ct Unit 763
- 5778 Rexford Ct Unit 5778B
- 5824 Rexford Dr Unit 731
- 8437 Forrester Blvd
- 5835 Fitzhugh St
- 5613 Mount Burnside Way
- 8344 Darlington St Unit 486
- 9009 Digory Ct
- 8372 Forrester Blvd Unit 478
- 6010 Timber Hollow Ln
- 8330 Darlington St Unit 467
- 8336 Forrester Blvd Unit 448
- 5604 Eastbourne Dr
- 5601 Southampton Dr
- 5532 Eastbourne Dr
- 5603 Southampton Dr
- 5601 Eastbourne Dr
- 5603 Eastbourne Dr
- 5601 Yorkshire St
- 5535 Eastbourne Dr
- 5605 Southampton Dr
- 5605 Eastbourne Dr
- 5610 Eastbourne Dr
- 5533 Eastbourne Dr
- 5530 Eastbourne Dr
- 5607 Eastbourne Dr
- 5529 Southampton Dr
- 5607 Southampton Dr
- 5600 Southampton Dr
- 5531 Eastbourne Dr
- 5612 Eastbourne Dr
- 5609 Eastbourne Dr