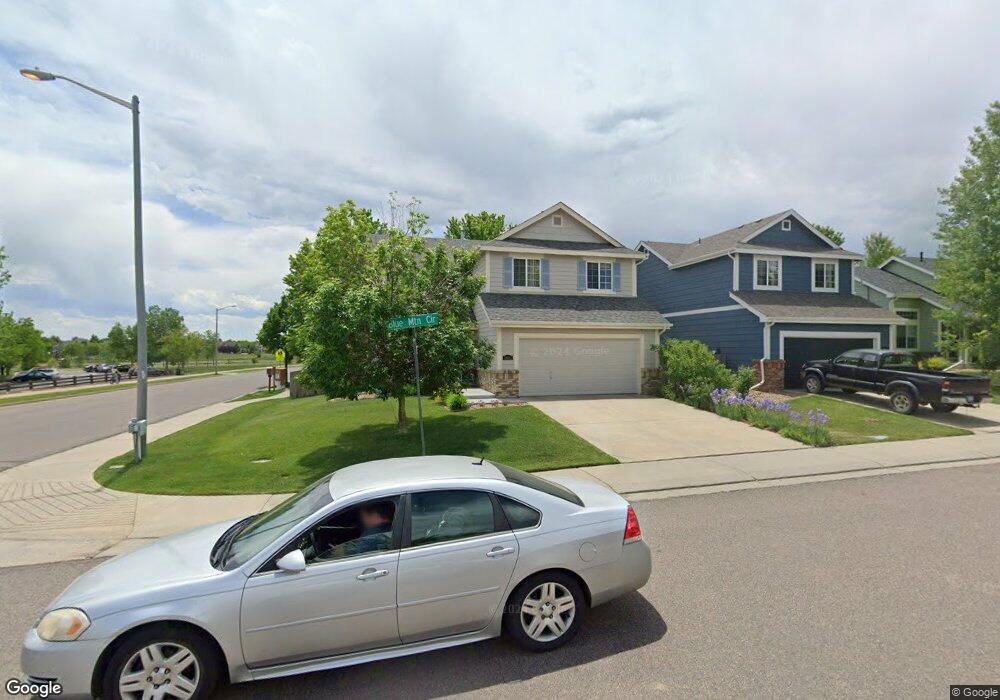
5602 Blue Mountain Cir Longmont, CO 80503
Upper Clover Basin NeighborhoodEstimated Value: $613,000 - $727,000
4
Beds
2
Baths
1,637
Sq Ft
$404/Sq Ft
Est. Value
About This Home
This home is located at 5602 Blue Mountain Cir, Longmont, CO 80503 and is currently estimated at $661,077, approximately $403 per square foot. 5602 Blue Mountain Cir is a home located in Boulder County with nearby schools including Blue Mountain Elementary School, Altona Middle School, and Silver Creek High School.
Ownership History
Date
Name
Owned For
Owner Type
Purchase Details
Closed on
Sep 14, 2012
Sold by
Mcvay Joshua J
Bought by
Mcvay Joshua J
Current Estimated Value
Home Financials for this Owner
Home Financials are based on the most recent Mortgage that was taken out on this home.
Original Mortgage
$176,000
Outstanding Balance
$29,328
Interest Rate
3.62%
Mortgage Type
New Conventional
Estimated Equity
$631,749
Purchase Details
Closed on
Oct 21, 2005
Sold by
Lennar Colorado Llc
Bought by
Mcvay Joshua J
Home Financials for this Owner
Home Financials are based on the most recent Mortgage that was taken out on this home.
Original Mortgage
$175,825
Interest Rate
5.75%
Mortgage Type
FHA
Purchase Details
Closed on
Dec 19, 2003
Sold by
Us Home Corp
Bought by
Lennar Colorado Llc
Home Financials for this Owner
Home Financials are based on the most recent Mortgage that was taken out on this home.
Original Mortgage
$5,197
Interest Rate
5.75%
Mortgage Type
Stand Alone Second
Create a Home Valuation Report for This Property
The Home Valuation Report is an in-depth analysis detailing your home's value as well as a comparison with similar homes in the area
Home Values in the Area
Average Home Value in this Area
Purchase History
| Date | Buyer | Sale Price | Title Company |
|---|---|---|---|
| Mcvay Joshua J | -- | Land Title Guarantee Company | |
| Mcvay Joshua J | $178,585 | North American Title | |
| Lennar Colorado Llc | -- | North American Title |
Source: Public Records
Mortgage History
| Date | Status | Borrower | Loan Amount |
|---|---|---|---|
| Open | Mcvay Joshua J | $176,000 | |
| Closed | Mcvay Joshua J | $175,825 | |
| Previous Owner | Lennar Colorado Llc | $5,197 |
Source: Public Records
Tax History Compared to Growth
Tax History
| Year | Tax Paid | Tax Assessment Tax Assessment Total Assessment is a certain percentage of the fair market value that is determined by local assessors to be the total taxable value of land and additions on the property. | Land | Improvement |
|---|---|---|---|---|
| 2025 | $3,822 | $41,557 | $8,763 | $32,794 |
| 2024 | $3,822 | $41,557 | $8,763 | $32,794 |
| 2023 | $3,770 | $39,952 | $9,313 | $34,324 |
| 2022 | $3,261 | $32,957 | $7,047 | $25,910 |
| 2021 | $3,304 | $33,905 | $7,250 | $26,655 |
| 2020 | $3,125 | $32,175 | $8,008 | $24,167 |
| 2019 | $3,076 | $32,175 | $8,008 | $24,167 |
| 2018 | $2,677 | $28,181 | $6,912 | $21,269 |
| 2017 | $2,640 | $31,156 | $7,642 | $23,514 |
| 2016 | $2,485 | $25,998 | $7,801 | $18,197 |
| 2015 | $2,368 | $22,025 | $5,174 | $16,851 |
| 2014 | $2,057 | $22,025 | $5,174 | $16,851 |
Source: Public Records
Map
Nearby Homes
- 5605 Mount Sanitas Ave
- 1106 Redbud Cir
- 5610 Four Leaf Dr
- 1513 Cannon Mountain Dr
- Concerto Plan at West Grange - The McStain Classic
- Harmony Plan at West Grange - The McStain Classic
- Virtuoso Plan at West Grange - The McStain Classic
- Serenade Plan at West Grange - The McStain Classic
- Interlude Plan at West Grange - The McStain Classic
- 5717 Four Leaf Dr
- 763 Mountain Dr
- 759 Mountain Dr
- 5584 Moosehead Cir
- 1638 Hallet Peak Dr
- 5595 Wheaton Ave
- 5025 Eagan Cir
- 5608 Grandville Ave
- 5604 Grandville Ave
- 2100 2-Story Front Load Plan at West Grange
- 2100 Retreat Modern Butterfly Plan at West Grange
- 5606 Blue Mountain Cir
- 5600 Mount Sanitas Ave
- 5610 Blue Mountain Cir
- 5604 Mount Sanitas Ave
- 5608 Mount Sanitas Ave
- 5603 Blue Mountain Cir
- 5614 Blue Mountain Cir
- 5607 Blue Mountain Cir
- 5612 Mount Sanitas Ave
- 5611 Blue Mountain Cir
- 5618 Blue Mountain Cir
- 5615 Blue Mountain Cir
- 5616 Mount Sanitas Ave
- 5622 Blue Mountain Cir
- 5601 Mount Sanitas Ave
- 5745 Boundary Place
- 5620 Mount Sanitas Ave
- 5751 Boundary Place
- 5613 Mount Sanitas Ave
- 5623 Blue Mountain Cir