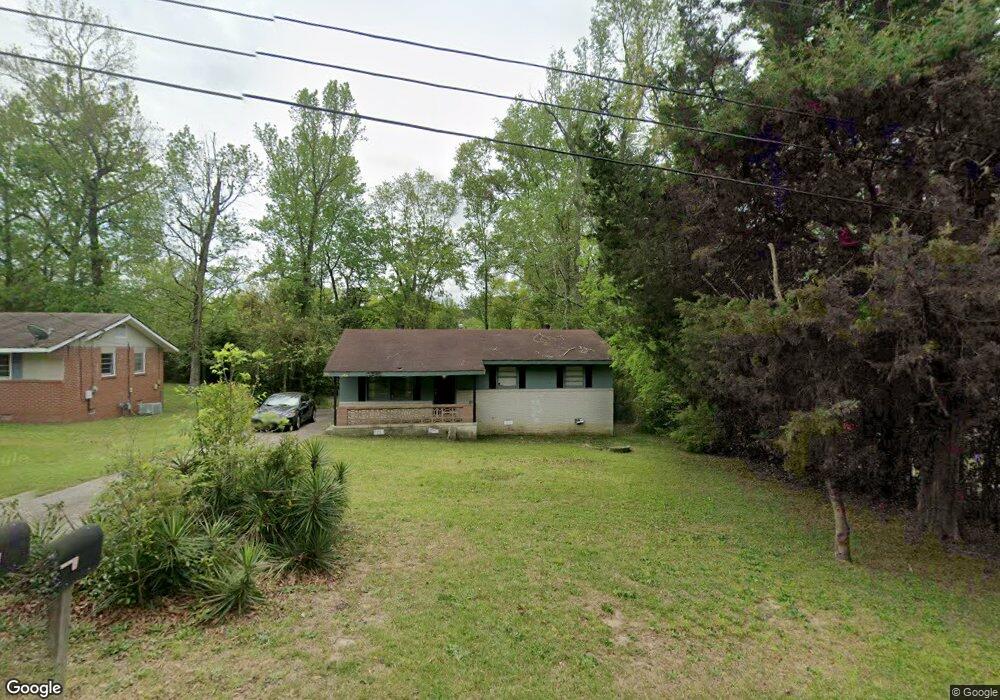
5604 Valleybrook Rd Columbus, GA 31907
Eastern Columbus NeighborhoodEstimated Value: $86,000 - $114,000
3
Beds
2
Baths
975
Sq Ft
$104/Sq Ft
Est. Value
About This Home
This home is located at 5604 Valleybrook Rd, Columbus, GA 31907 and is currently estimated at $101,469, approximately $104 per square foot. 5604 Valleybrook Rd is a home located in Muscogee County with nearby schools including Wesley Heights Elementary School, East Columbus Magnet Academy, and Kendrick High School.
Ownership History
Date
Name
Owned For
Owner Type
Purchase Details
Closed on
Mar 22, 2023
Sold by
Columbus 26 Partners Llc
Bought by
Macon Jh Sapir Llc
Current Estimated Value
Home Financials for this Owner
Home Financials are based on the most recent Mortgage that was taken out on this home.
Original Mortgage
$2,900,000
Outstanding Balance
$100,862
Interest Rate
6.12%
Mortgage Type
New Conventional
Estimated Equity
$607
Purchase Details
Closed on
Dec 21, 2021
Sold by
Cf Properties Llc
Bought by
Columbus 26 Partners Llc
Purchase Details
Closed on
Jan 3, 2019
Sold by
Lr Partners Llc
Bought by
Cf Properties Llc
Purchase Details
Closed on
Sep 17, 2013
Sold by
Ellorenco Mildred
Bought by
Lr Partners Llc
Create a Home Valuation Report for This Property
The Home Valuation Report is an in-depth analysis detailing your home's value as well as a comparison with similar homes in the area
Home Values in the Area
Average Home Value in this Area
Purchase History
| Date | Buyer | Sale Price | Title Company |
|---|---|---|---|
| Macon Jh Sapir Llc | $4,075,000 | -- | |
| Columbus 26 Partners Llc | $5,349,254 | -- | |
| Cf Properties Llc | $492,463 | -- | |
| Lr Partners Llc | $19,000 | -- |
Source: Public Records
Mortgage History
| Date | Status | Borrower | Loan Amount |
|---|---|---|---|
| Open | Macon Jh Sapir Llc | $2,900,000 |
Source: Public Records
Tax History Compared to Growth
Tax History
| Year | Tax Paid | Tax Assessment Tax Assessment Total Assessment is a certain percentage of the fair market value that is determined by local assessors to be the total taxable value of land and additions on the property. | Land | Improvement |
|---|---|---|---|---|
| 2025 | $1,364 | $34,844 | $7,232 | $27,612 |
| 2024 | $1,364 | $34,844 | $7,232 | $27,612 |
| 2023 | $933 | $23,680 | $7,232 | $16,448 |
| 2022 | $766 | $18,748 | $7,232 | $11,516 |
| 2021 | $674 | $16,500 | $7,232 | $9,268 |
| 2020 | $674 | $16,500 | $7,232 | $9,268 |
| 2019 | $575 | $16,500 | $7,232 | $9,268 |
| 2018 | $744 | $21,356 | $7,232 | $14,124 |
| 2017 | $878 | $21,356 | $7,232 | $14,124 |
| 2016 | $406 | $9,839 | $2,550 | $7,289 |
| 2015 | $163 | $9,839 | $2,550 | $7,289 |
| 2014 | $314 | $7,601 | $1,085 | $6,516 |
| 2013 | -- | $17,861 | $2,550 | $15,311 |
Source: Public Records
Map
Nearby Homes
- 5619 Valleybrook Rd
- 5542 Teresa St
- 5500 Amber Dr
- 4731 Marino St
- 5834 Blueridge Dr
- 5529 Pollman St
- 1524 Hagan Dr
- 1068 Valencia Dr
- 4722 Pollman St
- 5828 Georgetown Dr
- 6033 Luna Dr
- 6032 Cordova Rd
- 6047 Capri Cir
- 6061 Luna Dr
- 5532 Buena Vista Rd
- 5526 Buena Vista Rd
- 908 Arlington Dr
- 6119 Mill Branch Rd
- 5035 Gibbs Dr
- 1354 Floyd Rd
- 5552 Valleybrook Rd
- 5610 Valleybrook Rd
- 5546 Valleybrook Rd
- 5629 Mill Branch Rd
- 5616 Valleybrook Rd
- 5625 Mill Branch Rd
- 5619 Mill Branch Rd
- 5607 Valleybrook Rd
- 5555 Valleybrook Rd
- 5613 Mill Branch Rd
- 5540 Valleybrook Rd
- 5611 Valleybrook Rd
- 5631 Mill Branch Rd
- 5622 Valleybrook Rd
- 5549 Valleybrook Rd
- 5235 Mill Branch Rd
- 5243 Mill Branch Rd
- 5609 Mill Branch Rd
- 5543 Valleybrook Rd
- 5534 Valleybrook Rd