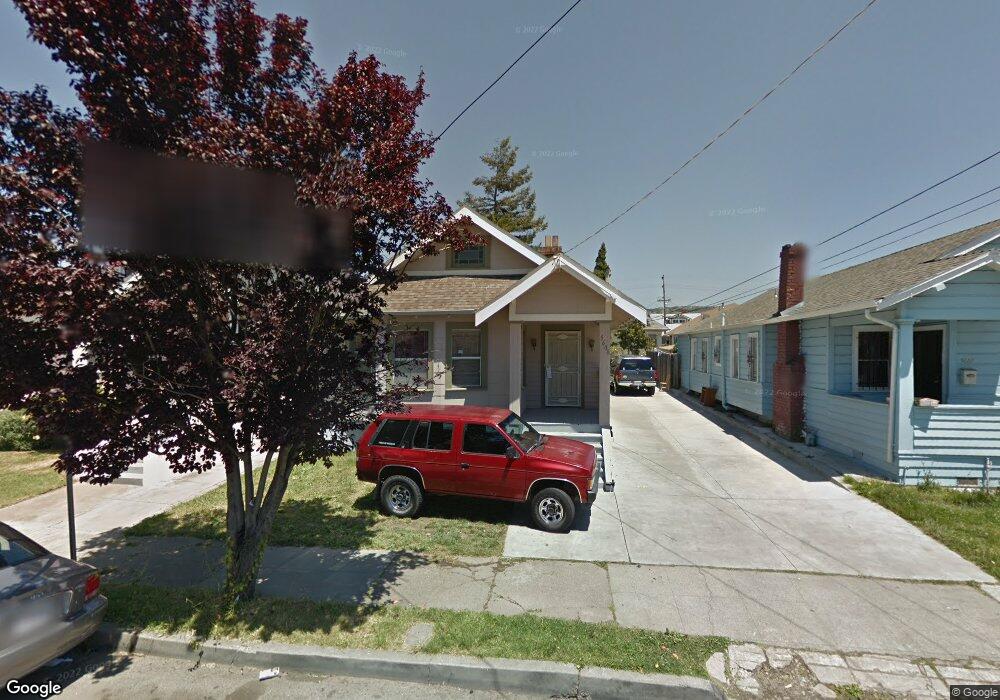
5606 E 16th St Oakland, CA 94621
Seminary NeighborhoodEstimated Value: $374,089 - $546,000
2
Beds
1
Bath
1,037
Sq Ft
$431/Sq Ft
Est. Value
About This Home
This home is located at 5606 E 16th St, Oakland, CA 94621 and is currently estimated at $447,272, approximately $431 per square foot. 5606 E 16th St is a home located in Alameda County with nearby schools including Greenleaf Elementary School, Coliseum College Prep Academy, and Fremont High School.
Ownership History
Date
Name
Owned For
Owner Type
Purchase Details
Closed on
Mar 1, 2017
Sold by
Wong Tony W and Kwong Cindy M
Bought by
Jwk Holdings 3 Llc
Current Estimated Value
Purchase Details
Closed on
Dec 16, 2014
Sold by
Wong Tony
Bought by
Wong Kwong Family Trust
Purchase Details
Closed on
Mar 12, 2010
Sold by
Aurora Loan Services Llc
Bought by
Wong Tony
Purchase Details
Closed on
Jan 26, 2010
Sold by
Chivalan Juan A
Bought by
Aurora Loan Services Llc
Purchase Details
Closed on
Dec 9, 1993
Sold by
Miller Walter E and Miller Maria
Bought by
Chivalan Juan A
Home Financials for this Owner
Home Financials are based on the most recent Mortgage that was taken out on this home.
Original Mortgage
$117,800
Interest Rate
3.75%
Create a Home Valuation Report for This Property
The Home Valuation Report is an in-depth analysis detailing your home's value as well as a comparison with similar homes in the area
Home Values in the Area
Average Home Value in this Area
Purchase History
| Date | Buyer | Sale Price | Title Company |
|---|---|---|---|
| Jwk Holdings 3 Llc | -- | None Available | |
| Wong Kwong Family Trust | -- | None Available | |
| Wong Tony | $108,000 | Fidelity National Title Co | |
| Aurora Loan Services Llc | $210,000 | Accommodation | |
| Chivalan Juan A | $124,000 | Fidelity National Title Ins |
Source: Public Records
Mortgage History
| Date | Status | Borrower | Loan Amount |
|---|---|---|---|
| Previous Owner | Chivalan Juan A | $117,800 |
Source: Public Records
Tax History
| Year | Tax Paid | Tax Assessment Tax Assessment Total Assessment is a certain percentage of the fair market value that is determined by local assessors to be the total taxable value of land and additions on the property. | Land | Improvement |
|---|---|---|---|---|
| 2025 | $3,571 | $139,398 | $41,819 | $97,579 |
| 2024 | $3,571 | $136,665 | $40,999 | $95,666 |
| 2023 | $3,636 | $133,986 | $40,196 | $93,790 |
| 2022 | $3,476 | $131,360 | $39,408 | $91,952 |
| 2021 | $3,186 | $128,784 | $38,635 | $90,149 |
| 2020 | $3,149 | $127,465 | $38,239 | $89,226 |
| 2019 | $2,944 | $124,966 | $37,490 | $87,476 |
| 2018 | $2,886 | $122,517 | $36,755 | $85,762 |
| 2017 | $2,744 | $120,114 | $36,034 | $84,080 |
| 2016 | $2,571 | $117,760 | $35,328 | $82,432 |
| 2015 | $2,554 | $115,992 | $34,797 | $81,195 |
| 2014 | $2,480 | $113,721 | $34,116 | $79,605 |
Source: Public Records
Map
Nearby Homes
- 5715 E 16th St
- 1433 56th Ave
- 5440 Wadean Place
- 5910 International Blvd
- 5914 International Blvd
- 5339 Princeton St
- 5400 Princeton St
- 1363 61st Ave
- 1301 60th Ave
- 1244 58th Ave
- 1610 52nd Ave
- 1826 Vicksburg Ave Unit 1
- 5955 Hayes St
- 1304 62nd Ave
- 5116 Bancroft Ave
- 5315 Cole St
- 6241 Bromley Ave
- 1618 51st Ave
- 1243 62nd Ave
- 5503 Foothill Blvd
Your Personal Tour Guide
Ask me questions while you tour the home.