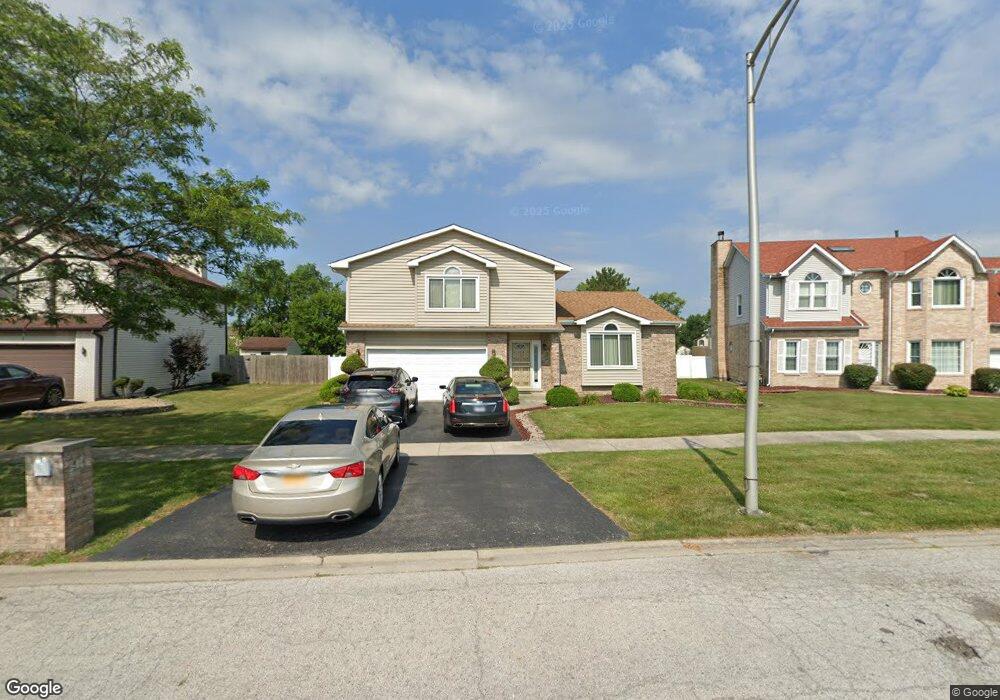
5608 Feathercreek Rd Matteson, IL 60443
West Matteson NeighborhoodEstimated Value: $345,000 - $413,000
5
Beds
3
Baths
2,633
Sq Ft
$138/Sq Ft
Est. Value
About This Home
This home is located at 5608 Feathercreek Rd, Matteson, IL 60443 and is currently estimated at $364,327, approximately $138 per square foot. 5608 Feathercreek Rd is a home located in Cook County with nearby schools including Colin Powell Middle School.
Ownership History
Date
Name
Owned For
Owner Type
Purchase Details
Closed on
Jul 13, 2017
Sold by
Jones Lance S and Jones Beverly L
Bought by
Looney Lawernce and Looney Kathryn
Current Estimated Value
Home Financials for this Owner
Home Financials are based on the most recent Mortgage that was taken out on this home.
Original Mortgage
$211,105
Outstanding Balance
$181,694
Interest Rate
5.37%
Mortgage Type
FHA
Estimated Equity
$182,634
Purchase Details
Closed on
Jan 14, 1994
Sold by
Maywood Proviso State Bank
Bought by
Jones Lance S and Jones Beverly L
Home Financials for this Owner
Home Financials are based on the most recent Mortgage that was taken out on this home.
Original Mortgage
$160,800
Interest Rate
6.25%
Mortgage Type
Construction
Create a Home Valuation Report for This Property
The Home Valuation Report is an in-depth analysis detailing your home's value as well as a comparison with similar homes in the area
Home Values in the Area
Average Home Value in this Area
Purchase History
| Date | Buyer | Sale Price | Title Company |
|---|---|---|---|
| Looney Lawernce | $215,000 | Fidelity National Title | |
| Jones Lance S | $25,000 | -- |
Source: Public Records
Mortgage History
| Date | Status | Borrower | Loan Amount |
|---|---|---|---|
| Open | Looney Lawernce | $211,105 | |
| Previous Owner | Jones Lance S | $160,800 |
Source: Public Records
Tax History Compared to Growth
Tax History
| Year | Tax Paid | Tax Assessment Tax Assessment Total Assessment is a certain percentage of the fair market value that is determined by local assessors to be the total taxable value of land and additions on the property. | Land | Improvement |
|---|---|---|---|---|
| 2024 | $4,867 | $29,000 | $5,311 | $23,689 |
| 2023 | $6,851 | $29,000 | $5,311 | $23,689 |
| 2022 | $6,851 | $20,670 | $4,587 | $16,083 |
| 2021 | $6,373 | $20,669 | $4,587 | $16,082 |
| 2020 | $5,737 | $20,669 | $4,587 | $16,082 |
| 2019 | $6,653 | $19,036 | $4,104 | $14,932 |
| 2018 | $6,920 | $19,036 | $4,104 | $14,932 |
| 2017 | $6,785 | $19,036 | $4,104 | $14,932 |
| 2016 | $7,844 | $17,655 | $3,621 | $14,034 |
| 2015 | $7,638 | $17,655 | $3,621 | $14,034 |
| 2014 | $8,284 | $19,327 | $3,621 | $15,706 |
| 2013 | $9,125 | $22,464 | $3,621 | $18,843 |
Source: Public Records
Map
Nearby Homes
- 322 Central Ave
- 255 Central Ave
- 5628 Crestwood Rd
- 5808 Allemong Dr
- 340 Maryview Ct
- 116 Cloverleaf Rd
- 125 Deerpath Rd
- 111 Deerpath Rd
- 217 Oriole Rd
- 5728 Woodgate Dr
- 123 Oriole Rd
- 246 Owen St
- 202 Owen St
- 192 Owen St
- 25 Pheasant Rd
- 5911 Timberlane Rd
- 175 Owen St
- 5838 Woodgate Dr
- 13 Oakview Rd
- 5631 Colgate Ln
- 5614 Feathercreek Rd
- 5602 Feathercreek Rd
- 5613 Allemong Dr
- 5620 Feathercreek Rd
- 5550 Feathercreek Rd
- 5611 Allemong Dr
- 5615 Allemong Dr
- 5609 Feathercreek Rd
- 5545 Feathercreek Rd
- 5544 Feathercreek Rd
- 5615 Feathercreek Rd
- 5626 Feathercreek Rd
- 5609 Allemong Dr
- 5567 Allemong Dr Unit 3614
- 5565 Allemong Dr Unit 3611
- 5563 Allemong Dr Unit 3613
- 5561 Allemong Dr Unit 3612
- 5619 Allemong Dr
- 5538 Feathercreek Rd