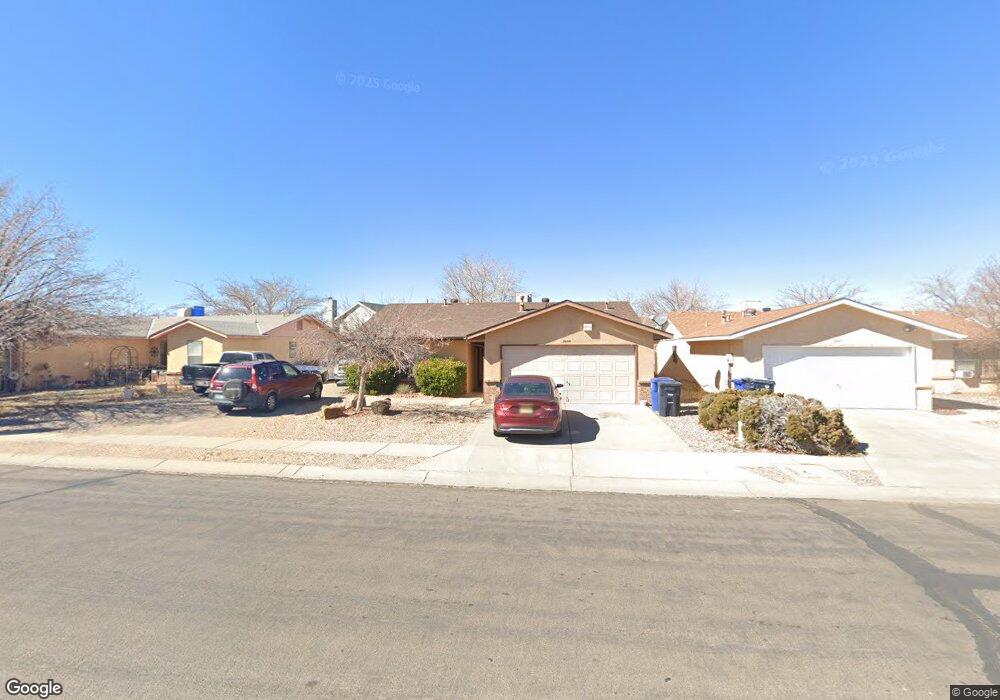
5609 Kachina St NW Albuquerque, NM 87120
Taylor Ranch NeighborhoodEstimated Value: $270,000 - $307,000
3
Beds
2
Baths
1,100
Sq Ft
$263/Sq Ft
Est. Value
About This Home
This home is located at 5609 Kachina St NW, Albuquerque, NM 87120 and is currently estimated at $288,921, approximately $262 per square foot. 5609 Kachina St NW is a home located in Bernalillo County with nearby schools including Marie M. Hughes Elementary School, L.B. Johnson Middle School, and Volcano Vista High School.
Ownership History
Date
Name
Owned For
Owner Type
Purchase Details
Closed on
Oct 17, 2008
Sold by
Scogin Karen L
Bought by
Scott George A
Current Estimated Value
Home Financials for this Owner
Home Financials are based on the most recent Mortgage that was taken out on this home.
Original Mortgage
$119,800
Outstanding Balance
$79,032
Interest Rate
6.35%
Mortgage Type
Purchase Money Mortgage
Estimated Equity
$209,889
Purchase Details
Closed on
Aug 28, 2008
Sold by
Scogin Robert C
Bought by
Scogin Karen L
Home Financials for this Owner
Home Financials are based on the most recent Mortgage that was taken out on this home.
Original Mortgage
$119,800
Outstanding Balance
$79,032
Interest Rate
6.35%
Mortgage Type
Purchase Money Mortgage
Estimated Equity
$209,889
Purchase Details
Closed on
Sep 10, 2004
Sold by
Hofheins Mark E and Garcia Vanessa
Bought by
Scogin Robert C and Scogin Karen L
Home Financials for this Owner
Home Financials are based on the most recent Mortgage that was taken out on this home.
Original Mortgage
$86,880
Interest Rate
7.32%
Mortgage Type
Purchase Money Mortgage
Create a Home Valuation Report for This Property
The Home Valuation Report is an in-depth analysis detailing your home's value as well as a comparison with similar homes in the area
Home Values in the Area
Average Home Value in this Area
Purchase History
| Date | Buyer | Sale Price | Title Company |
|---|---|---|---|
| Scott George A | -- | Fidelity Natl Title Ins Co | |
| Scogin Karen L | -- | None Available | |
| Scogin Robert C | -- | Rio Grande Title Company Inc |
Source: Public Records
Mortgage History
| Date | Status | Borrower | Loan Amount |
|---|---|---|---|
| Open | Scott George A | $119,800 | |
| Previous Owner | Scogin Robert C | $86,880 | |
| Closed | Scogin Robert C | $21,720 |
Source: Public Records
Tax History Compared to Growth
Tax History
| Year | Tax Paid | Tax Assessment Tax Assessment Total Assessment is a certain percentage of the fair market value that is determined by local assessors to be the total taxable value of land and additions on the property. | Land | Improvement |
|---|---|---|---|---|
| 2025 | $2,112 | $51,550 | $11,863 | $39,687 |
| 2024 | $2,112 | $50,049 | $11,518 | $38,531 |
| 2023 | $2,076 | $48,592 | $11,183 | $37,409 |
| 2022 | $2,007 | $47,176 | $10,857 | $36,319 |
| 2021 | $1,939 | $45,803 | $10,541 | $35,262 |
| 2020 | $1,907 | $44,469 | $10,234 | $34,235 |
| 2019 | $1,851 | $43,174 | $9,936 | $33,238 |
| 2018 | $1,786 | $43,174 | $9,936 | $33,238 |
| 2017 | $1,731 | $41,917 | $9,647 | $32,270 |
| 2016 | $1,746 | $41,030 | $9,366 | $31,664 |
| 2015 | $40,463 | $40,463 | $9,366 | $31,097 |
| 2014 | $1,728 | $40,685 | $10,424 | $30,261 |
| 2013 | -- | $39,500 | $10,121 | $29,379 |
Source: Public Records
Map
Nearby Homes
- 5305 Desert Sand Place NW
- 6616 Meadow Lake Place NW
- 5429 Gold Rush Dr NW
- 5404 Territorial Rd NW
- 6101 Chimayo Dr NW
- 5609 Cambria Rd NW
- 6420 Pojoaque Rd NW
- 6116 Agate Ave NW
- 6005 Rio Pueblo Dr NW
- 5901 Chimayo Dr NW
- 5805 Chimayo Dr NW
- 6133 Flor de Mayo Place NW
- 5432 Mariposa Dr NW
- 5504 Hayes Dr NW
- 6012 Open Sky Dr NW
- 6921 El Cajon Ct NW
- 4911 Alberta Ln NW
- 6020 Jamers Place NW
- 4900 Alberta Ln NW
- 7300 Target Ln NW
- 5605 Kachina St NW
- 5613 Kachina St NW
- 5601 Kachina St NW
- 6308 Winchester St NW
- 5617 Kachina St NW
- 6312 Winchester St NW
- 5608 Kachina St NW
- 5622 Still Brooke Ave NW
- 5523 Kachina St NW
- 5612 Kachina St NW
- 5618 Still Brooke Ave NW
- 5616 Kachina St NW
- 6316 Winchester St NW
- 5622 Stillbrooke Ave NW
- 5620 Kachina St NW
- 5614 Still Brooke Ave NW
- 6313 Kearney Trail NW
- 6313 Kearny Trail NW
- 5519 Kachina St NW
- 6309 Winchester St NW