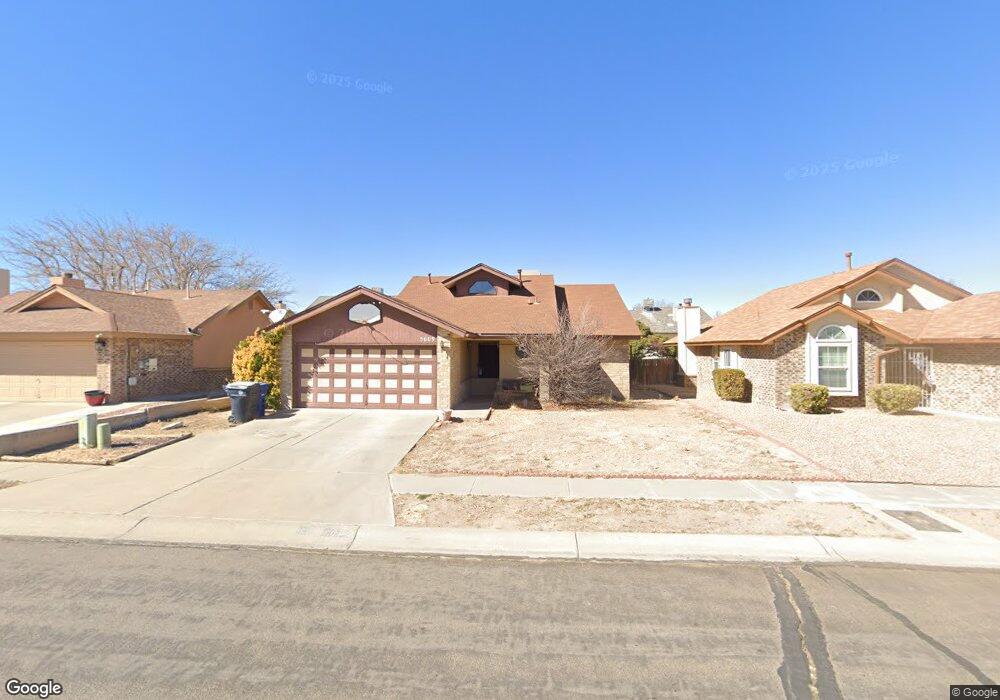
5609 Still Brooke Ave NW Albuquerque, NM 87120
Taylor Ranch NeighborhoodEstimated Value: $297,000 - $312,000
3
Beds
2
Baths
1,290
Sq Ft
$238/Sq Ft
Est. Value
About This Home
This home is located at 5609 Still Brooke Ave NW, Albuquerque, NM 87120 and is currently estimated at $307,572, approximately $238 per square foot. 5609 Still Brooke Ave NW is a home located in Bernalillo County with nearby schools including Marie M. Hughes Elementary School, L.B. Johnson Middle School, and Volcano Vista High School.
Ownership History
Date
Name
Owned For
Owner Type
Purchase Details
Closed on
Jun 20, 2022
Sold by
Kevin Deegan Michael
Bought by
Deegan Michael Kevin
Current Estimated Value
Home Financials for this Owner
Home Financials are based on the most recent Mortgage that was taken out on this home.
Original Mortgage
$135,000
Outstanding Balance
$112,831
Interest Rate
4.43%
Mortgage Type
New Conventional
Estimated Equity
$194,741
Purchase Details
Closed on
Nov 23, 2009
Sold by
Deegan Jennifer Marie
Bought by
Deegan Michaell Kevin
Home Financials for this Owner
Home Financials are based on the most recent Mortgage that was taken out on this home.
Original Mortgage
$131,461
Interest Rate
4.99%
Mortgage Type
FHA
Purchase Details
Closed on
Mar 2, 2001
Sold by
Cameron Richard
Bought by
Deegan Michael
Purchase Details
Closed on
Mar 1, 2001
Sold by
Cameron Richard
Bought by
Ocegan Mike
Create a Home Valuation Report for This Property
The Home Valuation Report is an in-depth analysis detailing your home's value as well as a comparison with similar homes in the area
Home Values in the Area
Average Home Value in this Area
Purchase History
| Date | Buyer | Sale Price | Title Company |
|---|---|---|---|
| Deegan Michael Kevin | -- | None Listed On Document | |
| Deegan Michaell Kevin | -- | Fidelity Natl Title Ins Co | |
| Deegan Michael | -- | -- | |
| Ocegan Mike | $70,625 | -- |
Source: Public Records
Mortgage History
| Date | Status | Borrower | Loan Amount |
|---|---|---|---|
| Open | Deegan Michael Kevin | $135,000 | |
| Previous Owner | Deegan Michaell Kevin | $131,461 |
Source: Public Records
Tax History Compared to Growth
Tax History
| Year | Tax Paid | Tax Assessment Tax Assessment Total Assessment is a certain percentage of the fair market value that is determined by local assessors to be the total taxable value of land and additions on the property. | Land | Improvement |
|---|---|---|---|---|
| 2025 | $2,435 | $59,446 | $11,314 | $48,132 |
| 2024 | $2,435 | $57,714 | $10,984 | $46,730 |
| 2023 | $2,395 | $56,034 | $10,665 | $45,369 |
| 2022 | $2,314 | $54,402 | $10,354 | $44,048 |
| 2021 | $2,236 | $52,818 | $10,053 | $42,765 |
| 2020 | $2,200 | $51,279 | $9,760 | $41,519 |
| 2019 | $2,135 | $49,786 | $9,476 | $40,310 |
| 2018 | $2,059 | $49,786 | $9,476 | $40,310 |
| 2017 | $1,996 | $48,336 | $9,200 | $39,136 |
| 2016 | $1,966 | $46,208 | $9,200 | $37,008 |
| 2015 | $44,862 | $44,862 | $8,932 | $35,930 |
| 2014 | $1,899 | $44,713 | $10,120 | $34,593 |
| 2013 | -- | $43,411 | $9,825 | $33,586 |
Source: Public Records
Map
Nearby Homes
- 5305 Desert Sand Place NW
- 6616 Meadow Lake Place NW
- 5429 Gold Rush Dr NW
- 5404 Territorial Rd NW
- 6116 Agate Ave NW
- 6420 Pojoaque Rd NW
- 6101 Chimayo Dr NW
- 7104 Mojave St NW
- 6012 Open Sky Dr NW
- 5609 Cambria Rd NW
- 5901 Chimayo Dr NW
- 6005 Rio Pueblo Dr NW
- 5805 Chimayo Dr NW
- 6133 Flor de Mayo Place NW
- 6921 El Cajon Ct NW
- 5504 Hayes Dr NW
- 5432 Mariposa Dr NW
- 7300 Target Ln NW
- 7413 Target Ln NW
- 6020 Jamers Place NW
- 5615 Still Brooke Ave NW
- 5605 Still Brooke Ave NW
- 5605 Stillbrooke Ave NW
- 2423 Stillbrooke Ave NW
- 5608 Timberline Ave NW
- 5617 Stillbrooke Ave NW
- 5617 Still Brooke Ave NW
- 5601 Stillbrooke Ave NW
- 5601 5601 Stillbrook St
- 5601 Still Brooke Ave NW
- 5614 Timberline Ave NW
- 5604 Timberline Ave NW
- 5618 Timberline Ave NW
- 5600 Timberline Ave NW
- 5608 Stillbrooke Ave NW
- 5517 Stillbrooke Ave NW
- 5621 Still Brooke Ave NW
- 5604 Stillbrooke Ave NW
- 5517 Still Brooke Ave NW
- 5604 Still Brooke Ave NW