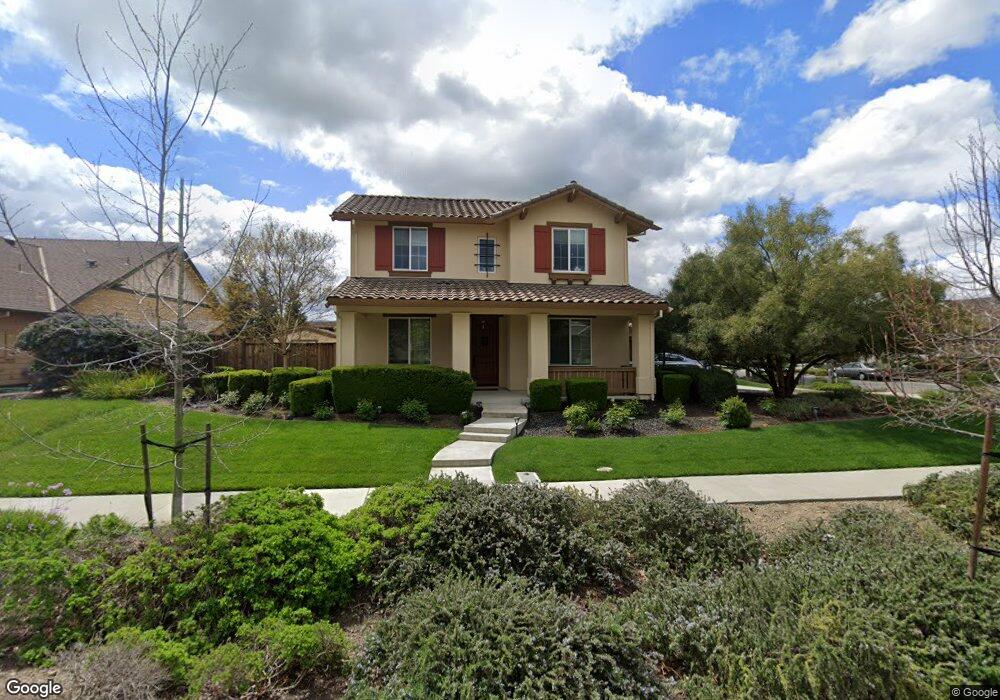
5611 Stockton Loop Livermore, CA 94550
Estimated Value: $1,916,000 - $2,291,000
4
Beds
3
Baths
3,015
Sq Ft
$697/Sq Ft
Est. Value
About This Home
This home is located at 5611 Stockton Loop, Livermore, CA 94550 and is currently estimated at $2,100,920, approximately $696 per square foot. 5611 Stockton Loop is a home located in Alameda County with nearby schools including Arroyo Seco Elementary School, East Avenue Middle School, and Livermore High School.
Ownership History
Date
Name
Owned For
Owner Type
Purchase Details
Closed on
Sep 20, 2018
Sold by
Nguyen Danny Tien and Rahbar Fonda F
Bought by
Nguyen Danny T and Rabbar Fonda
Current Estimated Value
Purchase Details
Closed on
Nov 7, 2016
Sold by
Ubelhoer Stephen and Ubelhoer Stacey
Bought by
Nguyen Danny Tien and Rahbar Fonda F
Home Financials for this Owner
Home Financials are based on the most recent Mortgage that was taken out on this home.
Original Mortgage
$560,000
Outstanding Balance
$266,831
Interest Rate
3.57%
Mortgage Type
New Conventional
Estimated Equity
$1,834,089
Purchase Details
Closed on
Oct 2, 2013
Sold by
Ubelhoer Stephen and Ubelhoer Stacey
Bought by
Ubelhoer Stephen and Ubelhoer Stacey
Home Financials for this Owner
Home Financials are based on the most recent Mortgage that was taken out on this home.
Original Mortgage
$625,500
Interest Rate
4.55%
Mortgage Type
New Conventional
Purchase Details
Closed on
May 23, 2011
Sold by
South Livermore Development Company
Bought by
Ubelhoer Stephen and Theroux Stacey
Home Financials for this Owner
Home Financials are based on the most recent Mortgage that was taken out on this home.
Original Mortgage
$648,776
Interest Rate
4.73%
Mortgage Type
New Conventional
Create a Home Valuation Report for This Property
The Home Valuation Report is an in-depth analysis detailing your home's value as well as a comparison with similar homes in the area
Purchase History
| Date | Buyer | Sale Price | Title Company |
|---|---|---|---|
| Nguyen Danny T | -- | None Available | |
| Nguyen Danny Tien | $1,240,000 | North American Title | |
| Ubelhoer Stephen | -- | Old Republic Title Company | |
| Ubelhoer Stephen | $811,000 | Chicago Title Company |
Source: Public Records
Mortgage History
| Date | Status | Borrower | Loan Amount |
|---|---|---|---|
| Open | Nguyen Danny Tien | $560,000 | |
| Previous Owner | Ubelhoer Stephen | $625,500 | |
| Previous Owner | Ubelhoer Stephen | $648,776 |
Source: Public Records
Tax History
| Year | Tax Paid | Tax Assessment Tax Assessment Total Assessment is a certain percentage of the fair market value that is determined by local assessors to be the total taxable value of land and additions on the property. | Land | Improvement |
|---|---|---|---|---|
| 2025 | $17,860 | $1,559,594 | $348,168 | $1,218,426 |
| 2024 | $17,860 | $1,403,884 | $341,343 | $1,069,541 |
| 2023 | $17,610 | $1,383,220 | $334,650 | $1,048,570 |
| 2022 | $17,352 | $1,349,101 | $328,089 | $1,028,012 |
| 2021 | $16,293 | $1,322,515 | $321,657 | $1,007,858 |
| 2020 | $16,546 | $1,315,888 | $318,360 | $997,528 |
| 2019 | $16,719 | $1,290,096 | $312,120 | $977,976 |
| 2018 | $16,342 | $1,264,800 | $306,000 | $958,800 |
| 2017 | $15,946 | $1,240,000 | $300,000 | $940,000 |
| 2016 | $11,456 | $877,595 | $307,142 | $570,453 |
| 2015 | $10,778 | $864,418 | $302,530 | $561,888 |
| 2014 | $10,604 | $847,487 | $296,605 | $550,882 |
Source: Public Records
Map
Nearby Homes
- 5564 Stockton Loop
- 2583 Cooper Cir
- 5454 Stockton Loop
- 2410 Robinson Cir
- 5143 Tesla Rd
- 5590 Hopps Ln
- 4669 Almond Cir
- 1368 Pegan Common
- 5218 Norma Way
- 1042 Dana Cir
- 2779 Silverado Ct
- 912 Loyola Way
- 1635 Embassy Cir
- 1762 Cheryl Dr
- 907 Hazel St
- 4115 Freeda Ct
- 1411 Justine Ct
- 838 Hazel St
- 973 Jessica Dr
- 656 Carla St
- 5625 Stockton Loop
- 2562 Cooper Cir
- 2505 Cooper Cir
- 5633 Stockton Loop
- 5608 Stockton Loop
- 2527 Cooper Cir
- 2778 Cooper Cir
- 2570 Cooper Cir
- 5614 Stockton Loop
- 2559 Cooper Cir
- 5586 Stockton Loop
- 5630 Stockton Loop
- 2740 Cooper Cir
- 5570 Stockton Loop
- 2575 Cooper Cir
- 5648 Stockton Loop
- 2602 Cooper Cir
- 2664 Cooper Cir
- 5548 Stockton Loop
- 5536 Stockton Loop
Your Personal Tour Guide
Ask me questions while you tour the home.