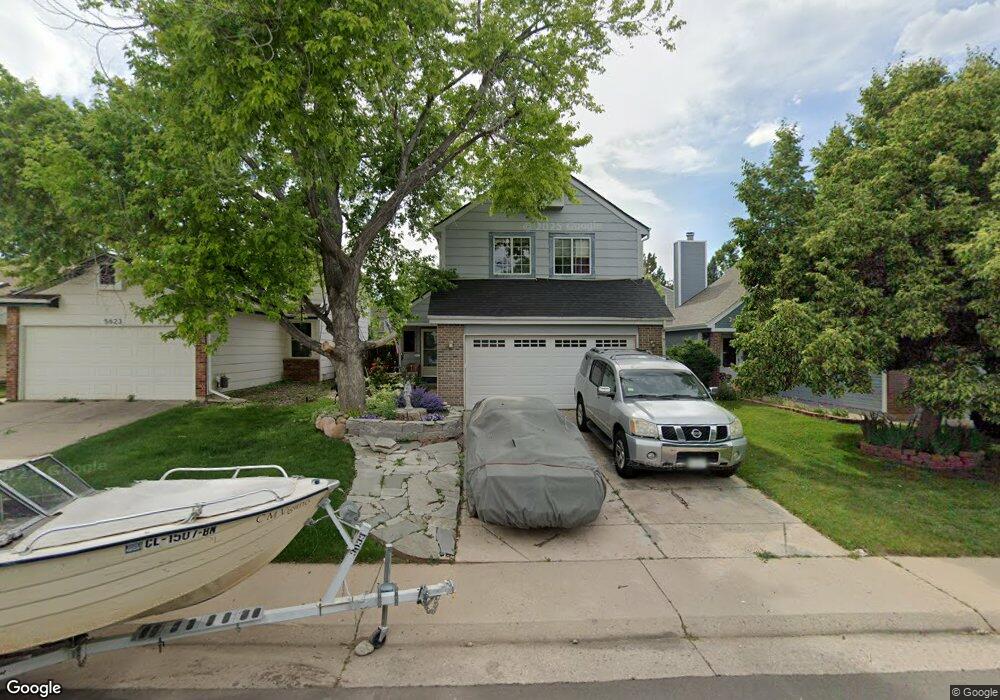
5613 S Yank Ct Littleton, CO 80127
Alkire Acres NeighborhoodEstimated Value: $532,797 - $578,000
3
Beds
3
Baths
1,382
Sq Ft
$407/Sq Ft
Est. Value
About This Home
This home is located at 5613 S Yank Ct, Littleton, CO 80127 and is currently estimated at $562,949, approximately $407 per square foot. 5613 S Yank Ct is a home located in Jefferson County with nearby schools including Mount Carbon Elementary School, Summit Ridge Middle School, and Dakota Ridge Senior High School.
Ownership History
Date
Name
Owned For
Owner Type
Purchase Details
Closed on
Apr 29, 2002
Sold by
Comer Joseph A and Comer Jody H
Bought by
Williams Roger N
Current Estimated Value
Home Financials for this Owner
Home Financials are based on the most recent Mortgage that was taken out on this home.
Original Mortgage
$206,755
Outstanding Balance
$88,409
Interest Rate
7.11%
Mortgage Type
FHA
Estimated Equity
$474,540
Purchase Details
Closed on
Mar 14, 1997
Sold by
Houghtling Kenneth R and Houghtling Annette M
Bought by
Comer Joseph A and Comer Jody H
Home Financials for this Owner
Home Financials are based on the most recent Mortgage that was taken out on this home.
Original Mortgage
$120,550
Interest Rate
7.74%
Mortgage Type
FHA
Create a Home Valuation Report for This Property
The Home Valuation Report is an in-depth analysis detailing your home's value as well as a comparison with similar homes in the area
Home Values in the Area
Average Home Value in this Area
Purchase History
| Date | Buyer | Sale Price | Title Company |
|---|---|---|---|
| Williams Roger N | $210,000 | Stewart Title | |
| Comer Joseph A | $127,900 | Empire Title & Escrow |
Source: Public Records
Mortgage History
| Date | Status | Borrower | Loan Amount |
|---|---|---|---|
| Open | Williams Roger N | $206,755 | |
| Previous Owner | Comer Joseph A | $120,550 |
Source: Public Records
Tax History Compared to Growth
Tax History
| Year | Tax Paid | Tax Assessment Tax Assessment Total Assessment is a certain percentage of the fair market value that is determined by local assessors to be the total taxable value of land and additions on the property. | Land | Improvement |
|---|---|---|---|---|
| 2024 | $2,850 | $29,102 | $6,909 | $22,193 |
| 2023 | $2,850 | $29,102 | $6,909 | $22,193 |
| 2022 | $2,642 | $25,968 | $6,499 | $19,469 |
| 2021 | $2,673 | $26,715 | $6,686 | $20,029 |
| 2020 | $2,337 | $23,419 | $5,190 | $18,229 |
| 2019 | $2,313 | $23,419 | $5,190 | $18,229 |
| 2018 | $1,984 | $19,425 | $4,818 | $14,607 |
| 2017 | $1,813 | $19,425 | $4,818 | $14,607 |
| 2016 | $1,798 | $18,577 | $5,992 | $12,585 |
| 2015 | $1,514 | $18,577 | $5,992 | $12,585 |
| 2014 | $1,514 | $14,662 | $5,731 | $8,931 |
Source: Public Records
Map
Nearby Homes
- 5645 S Zang St
- 12956 W Cross Dr
- 5506 S Zinnia St
- 5466 S Zang Ct
- 12983 W Ida Ave Unit 304
- 12983 W Ida Ave Unit 408 (Studio)
- 12983 W Ida Ave Unit 401
- 12983 W Ida Ave Unit 400
- 12983 W Ida Ave Unit 300
- 12983 W Ida Ave Unit 301
- 12983 W Ida Ave Unit 409 (Studio)
- 12983 W Ida Ave Unit 321
- 12983 W Ida Ave Unit 320
- 12983 W Ida Ave Unit 317
- 12983 W Ida Ave Unit 315
- 12983 W Ida Ave Unit 313
- 12983 W Ida Ave Unit 312
- 12983 W Ida Ave Unit 310
- 12983 W Ida Ave Unit 309 (Studio)
- 12983 W Ida Ave Unit 306