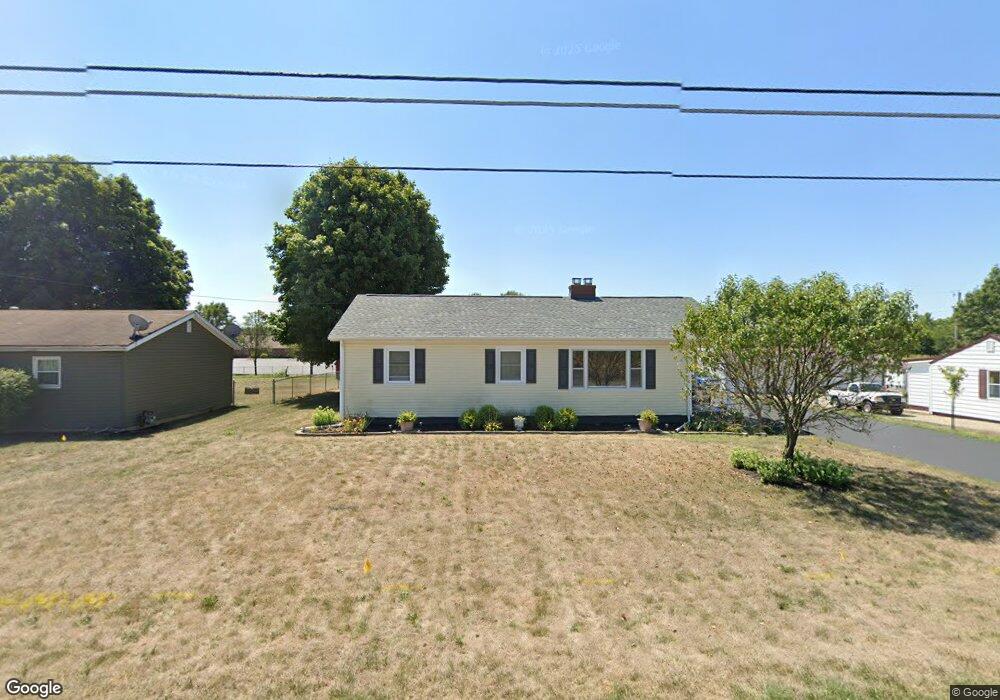
5613 Tarlton Rd Circleville, OH 43113
Estimated Value: $226,824 - $268,000
3
Beds
1
Bath
1,326
Sq Ft
$189/Sq Ft
Est. Value
About This Home
This home is located at 5613 Tarlton Rd, Circleville, OH 43113 and is currently estimated at $251,206, approximately $189 per square foot. 5613 Tarlton Rd is a home located in Pickaway County with nearby schools including Logan Elm High School and Crossroads Christian Academy.
Ownership History
Date
Name
Owned For
Owner Type
Purchase Details
Closed on
Jun 14, 2023
Sold by
Neff Jay
Bought by
Neff Jay and Neff Tonya Sue
Current Estimated Value
Home Financials for this Owner
Home Financials are based on the most recent Mortgage that was taken out on this home.
Original Mortgage
$150,000
Outstanding Balance
$145,989
Interest Rate
6.39%
Mortgage Type
New Conventional
Estimated Equity
$105,217
Purchase Details
Closed on
Dec 16, 2014
Sold by
Maxson Eric H and Maxson Diana L
Bought by
Neff Jay
Home Financials for this Owner
Home Financials are based on the most recent Mortgage that was taken out on this home.
Original Mortgage
$115,862
Interest Rate
3.88%
Mortgage Type
FHA
Purchase Details
Closed on
Jan 22, 2013
Sold by
Maxson Donald R and Maxson Nancy L
Bought by
Maxson Eric H and Maxson Diana L
Purchase Details
Closed on
Sep 15, 1993
Sold by
Troehler Oscar
Bought by
Maxson Donald R
Create a Home Valuation Report for This Property
The Home Valuation Report is an in-depth analysis detailing your home's value as well as a comparison with similar homes in the area
Home Values in the Area
Average Home Value in this Area
Purchase History
| Date | Buyer | Sale Price | Title Company |
|---|---|---|---|
| Neff Jay | -- | Doma Title | |
| Neff Jay | $118,000 | First Source Title | |
| Maxson Eric H | $92,700 | Attorney | |
| Maxson Donald R | $75,000 | -- |
Source: Public Records
Mortgage History
| Date | Status | Borrower | Loan Amount |
|---|---|---|---|
| Open | Neff Jay | $150,000 | |
| Previous Owner | Neff Jay | $115,862 |
Source: Public Records
Tax History Compared to Growth
Tax History
| Year | Tax Paid | Tax Assessment Tax Assessment Total Assessment is a certain percentage of the fair market value that is determined by local assessors to be the total taxable value of land and additions on the property. | Land | Improvement |
|---|---|---|---|---|
| 2024 | -- | $59,630 | $7,050 | $52,580 |
| 2023 | $1,958 | $59,630 | $7,050 | $52,580 |
| 2022 | $1,454 | $41,470 | $5,940 | $35,530 |
| 2021 | $1,492 | $41,470 | $5,940 | $35,530 |
| 2020 | $1,511 | $41,470 | $5,940 | $35,530 |
| 2019 | $1,153 | $34,120 | $5,940 | $28,180 |
| 2018 | $1,328 | $34,120 | $5,940 | $28,180 |
| 2017 | $1,914 | $34,120 | $5,940 | $28,180 |
| 2016 | $1,018 | $32,240 | $5,790 | $26,450 |
| 2015 | $1,049 | $32,240 | $5,790 | $26,450 |
| 2014 | $1,051 | $32,240 | $5,790 | $26,450 |
| 2013 | $1,184 | $36,340 | $5,790 | $30,550 |
Source: Public Records
Map
Nearby Homes
- 331 Tarlton Rd
- 311 Tarlton Rd
- 355 Cherokee Dr
- 25460 Us Highway 23 S
- 363 Logan St
- 373 Walnut St Unit REAR
- 0 Old Tarlton Pike
- 1303 S Pickaway St
- 466 John St
- 7241 State Route 56 E
- 339 Walnut St
- 546 E Ohio St
- 614 Renick Ave
- 705 Clinton St
- 364 Barnes Ave
- 160 Logan St
- 429 Half Ave
- 474 Half Ave
- 417 Half Ave
- 116 Town St
- 5593 Tarlton Rd
- 5633 Tarlton Rd
- 5567 Tarlton Rd
- 5679 Tarlton Rd
- 5527 Tarlton Rd
- 2220 Kingston Pike
- 2238 Kingston Pike
- 2246 Kingston Pike
- 2262 Kingston Pike
- 2262 Kingston Pike
- 2276 Kingston Pike
- 2284 Kingston Pike
- 2310 Kingston Pike
- 2340 Kingston Pike
- 5769 Tarlton Rd
- 2360 Kingston Pike
- 2370 Kingston Pike
- 2380 Kingston Pike
- 2085 Kingston Pike
- 2410 Kingston Pike