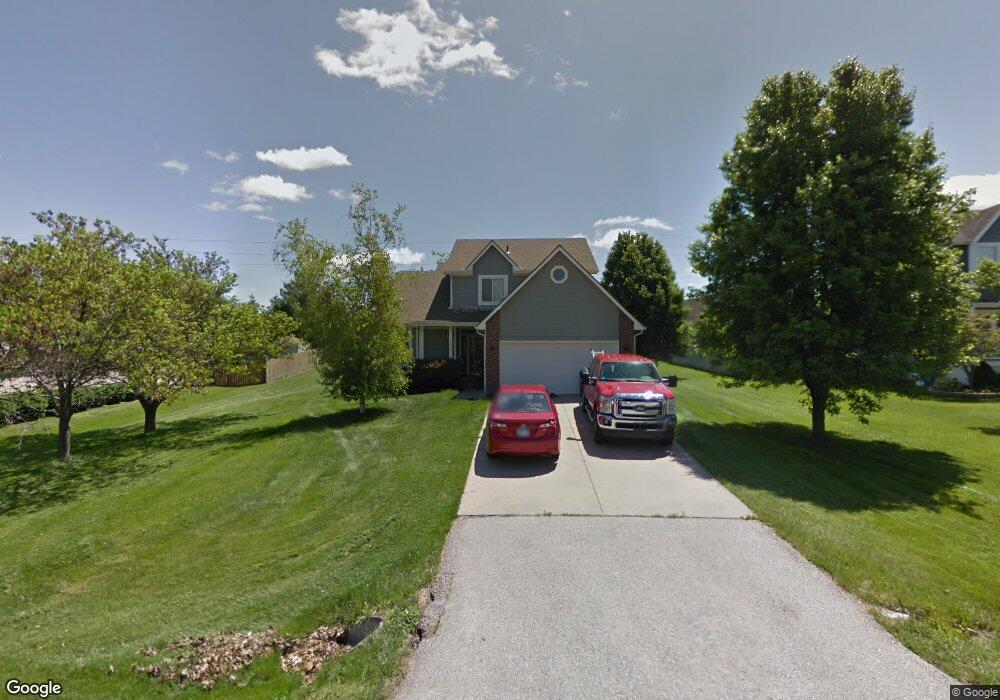
5615 Meadow View Dr Shawnee, KS 66226
Estimated Value: $390,000 - $515,000
3
Beds
3
Baths
1,741
Sq Ft
$247/Sq Ft
Est. Value
About This Home
This home is located at 5615 Meadow View Dr, Shawnee, KS 66226 and is currently estimated at $429,312, approximately $246 per square foot. 5615 Meadow View Dr is a home located in Johnson County with nearby schools including Belmont Elementary School, Mill Creek Middle School, and De Soto High School.
Ownership History
Date
Name
Owned For
Owner Type
Purchase Details
Closed on
Sep 15, 2022
Sold by
Jennifer Noyes
Bought by
Noyes Brent D
Current Estimated Value
Purchase Details
Closed on
Jun 30, 2003
Sold by
Noyes Brent D and Noyes Jennifer
Bought by
Noyes Brent D and Noyes Jennifer
Home Financials for this Owner
Home Financials are based on the most recent Mortgage that was taken out on this home.
Original Mortgage
$126,300
Interest Rate
5.23%
Mortgage Type
Purchase Money Mortgage
Purchase Details
Closed on
Oct 30, 2001
Sold by
Noyes Brent and Noyes Brent D
Bought by
Noyes Brent D
Home Financials for this Owner
Home Financials are based on the most recent Mortgage that was taken out on this home.
Original Mortgage
$117,000
Interest Rate
6.77%
Create a Home Valuation Report for This Property
The Home Valuation Report is an in-depth analysis detailing your home's value as well as a comparison with similar homes in the area
Home Values in the Area
Average Home Value in this Area
Purchase History
| Date | Buyer | Sale Price | Title Company |
|---|---|---|---|
| Noyes Brent D | -- | -- | |
| Noyes Brent D | -- | Chicago Title Insurance Co | |
| Noyes Brent D | -- | Chicago Title Insurance Co |
Source: Public Records
Mortgage History
| Date | Status | Borrower | Loan Amount |
|---|---|---|---|
| Previous Owner | Noyes Brent D | $126,300 | |
| Previous Owner | Noyes Brent D | $117,000 |
Source: Public Records
Tax History Compared to Growth
Tax History
| Year | Tax Paid | Tax Assessment Tax Assessment Total Assessment is a certain percentage of the fair market value that is determined by local assessors to be the total taxable value of land and additions on the property. | Land | Improvement |
|---|---|---|---|---|
| 2024 | $4,876 | $42,044 | $8,047 | $33,997 |
| 2023 | $4,816 | $40,986 | $8,047 | $32,939 |
| 2022 | $4,261 | $35,535 | $6,992 | $28,543 |
| 2021 | $4,166 | $33,338 | $6,656 | $26,682 |
| 2020 | $3,787 | $30,015 | $6,656 | $23,359 |
| 2019 | $3,714 | $29,003 | $5,795 | $23,208 |
| 2018 | $3,319 | $26,738 | $5,795 | $20,943 |
| 2017 | $3,405 | $25,703 | $5,037 | $20,666 |
| 2016 | $3,185 | $23,736 | $5,037 | $18,699 |
| 2015 | $3,182 | $23,368 | $5,037 | $18,331 |
| 2013 | -- | $21,448 | $5,037 | $16,411 |
Source: Public Records
Map
Nearby Homes
- 5625 Meadow View Dr
- 5221 Meadow View Dr
- 22605 W 56th St
- 5408 Aminda St
- 6122 Lewis Dr
- 6118 Lewis Dr
- 6114 Lewis Dr
- 6108 Lewis Dr
- 24207 W 58th Place
- 6119 Lewis Dr
- 6115 Lewis Dr
- 5531 Hilltop Dr
- 22310 W 58th St
- 5858 Mccormick Dr
- The Paxton III Plan at Canyon Lakes
- The Sydney III Plan at Canyon Lakes
- The Harlow V Plan at Canyon Lakes
- The Hailey Plan at Canyon Lakes
- The Brooklyn II Plan at Canyon Lakes
- The Niko Plan at Canyon Lakes
- 5605 Meadow View Dr
- 5565 Meadow View Dr
- 5645 Meadow View Dr
- 5620 Meadow View Dr
- 5610 Meadow View Dr
- 5564 Hedge Lane Terrace
- 5630 Meadow View Dr
- 5560 Meadow View Dr
- 5555 Meadow View Dr
- 5665 Meadow View Dr
- 5650 Meadow View Dr
- 5550 Meadow View Dr
- 5605 Meadow Sweet Ln
- 5615 Meadow Sweet Ln
- 23300 W 57th St
- 5535 Meadow View Dr
- 5565 Meadow Sweet Ln
- 71st & Mize Rd
- 000000 W 43rd & Frisbie Rd St
- 5625 Meadow Sweet Ln