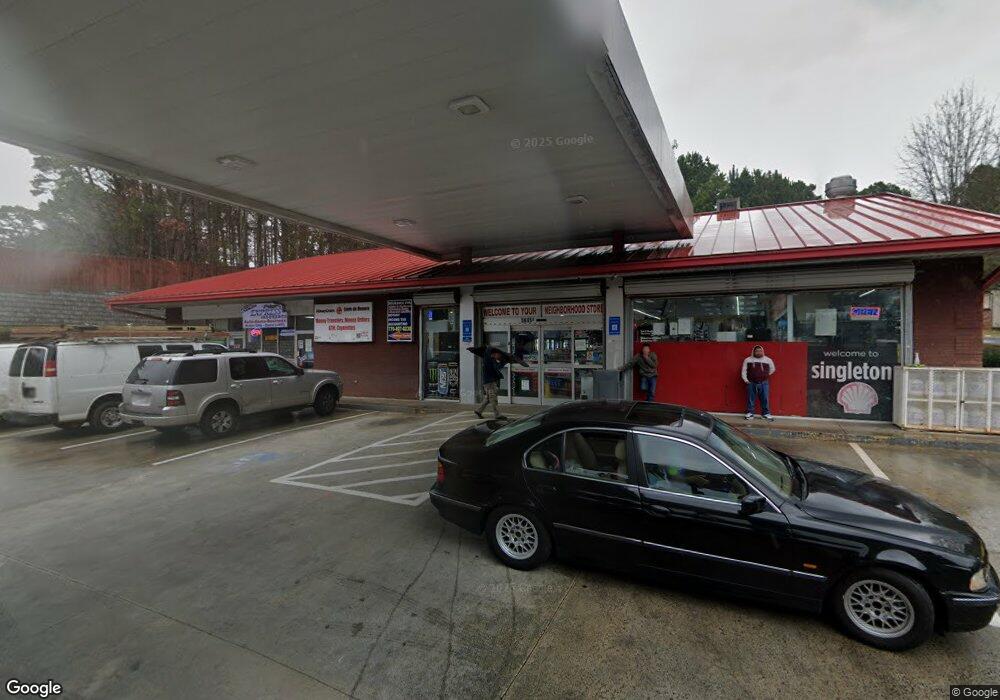
5615 Singleton Rd Norcross, GA 30093
Estimated Value: $4,379,952
Studio
4
Baths
5,100
Sq Ft
$859/Sq Ft
Est. Value
About This Home
This home is located at 5615 Singleton Rd, Norcross, GA 30093 and is currently estimated at $4,379,952, approximately $858 per square foot. 5615 Singleton Rd is a home located in Gwinnett County with nearby schools including Meadowcreek Elementary School, Louise Radloff Middle School, and Meadowcreek High School.
Ownership History
Date
Name
Owned For
Owner Type
Purchase Details
Closed on
Aug 21, 2012
Sold by
Niju Investments Inc
Bought by
Nizar Alibhai Investments Inc
Current Estimated Value
Home Financials for this Owner
Home Financials are based on the most recent Mortgage that was taken out on this home.
Original Mortgage
$1,300,000
Outstanding Balance
$891,402
Interest Rate
3.53%
Mortgage Type
Commercial
Estimated Equity
$3,488,550
Create a Home Valuation Report for This Property
The Home Valuation Report is an in-depth analysis detailing your home's value as well as a comparison with similar homes in the area
Home Values in the Area
Average Home Value in this Area
Purchase History
| Date | Buyer | Sale Price | Title Company |
|---|---|---|---|
| Nizar Alibhai Investments Inc | $1,300,000 | -- |
Source: Public Records
Mortgage History
| Date | Status | Borrower | Loan Amount |
|---|---|---|---|
| Open | Nizar Alibhai Investments Inc | $1,300,000 |
Source: Public Records
Tax History
| Year | Tax Paid | Tax Assessment Tax Assessment Total Assessment is a certain percentage of the fair market value that is determined by local assessors to be the total taxable value of land and additions on the property. | Land | Improvement |
|---|---|---|---|---|
| 2025 | $31,704 | $880,000 | $103,000 | $777,000 |
| 2024 | $32,056 | $1,141,280 | $103,000 | $1,038,280 |
| 2023 | $32,056 | $1,112,800 | $128,320 | $984,480 |
| 2022 | $40,371 | $1,112,800 | $128,320 | $984,480 |
| 2021 | $17,776 | $465,000 | $185,400 | $279,600 |
| 2020 | $17,892 | $465,000 | $185,400 | $279,600 |
| 2019 | $17,234 | $465,000 | $185,400 | $279,600 |
| 2018 | $17,303 | $465,000 | $185,400 | $279,600 |
| 2016 | $17,142 | $460,960 | $185,400 | $275,560 |
| 2015 | $17,341 | $460,960 | $185,400 | $275,560 |
| 2014 | $14,975 | $391,816 | $157,590 | $234,226 |
Source: Public Records
Map
Nearby Homes
- 1367 Myrtle Creek Dr
- 5663 Myrtle Creek Ct
- 5675 Terremont Cir
- 956 Six Oaks Cir Unit B
- 5719 Singlebriar Ct
- 5605 Rock Place Ct
- 1413 Silver Lake Dr
- 5554 Clover Rise Ln Unit 2
- 1193 Greenyard Way Unit 3
- 1572 Kings Ridge Dr Unit 3
- 1133 Sandune Dr
- 5341 Woodbin Dr
- 1317 Country Downs Dr
- 5271 Williams Rd Unit A-1
- 5345 Seattle Slew Ct Unit 3
- 5331 Sherwin Dr
- 5323 Sherwin Dr
- 5952 Robin Hood Ln
- 5737 Williamsburg Dr
- 1405 Commercial Ct
- 5627 Singleton Rd Unit 1
- 5635 Singleton Rd
- 1394 Harbins Rd
- 1400 Harbins Rd
- 1388 Harbins Rd
- 5643 Singleton Rd
- 1406 Harbins Rd Unit 1
- 5634 Singleton Rd
- 1412 Harbins Rd
- 1397 Saddle Ct
- 5644 Singleton Rd Unit 5
- 1376 Harbins Rd
- 5651 Singleton Rd
- 1407 Saddle Ct
- 1237 Roman Point Dr
- 1418 Harbins Rd Unit 1
- 1247 Roman Point Dr
- 1227 Roman Point Dr
- 1435 Harbins Rd Unit 5
- 5650 Singleton Rd
Your Personal Tour Guide
Ask me questions while you tour the home.