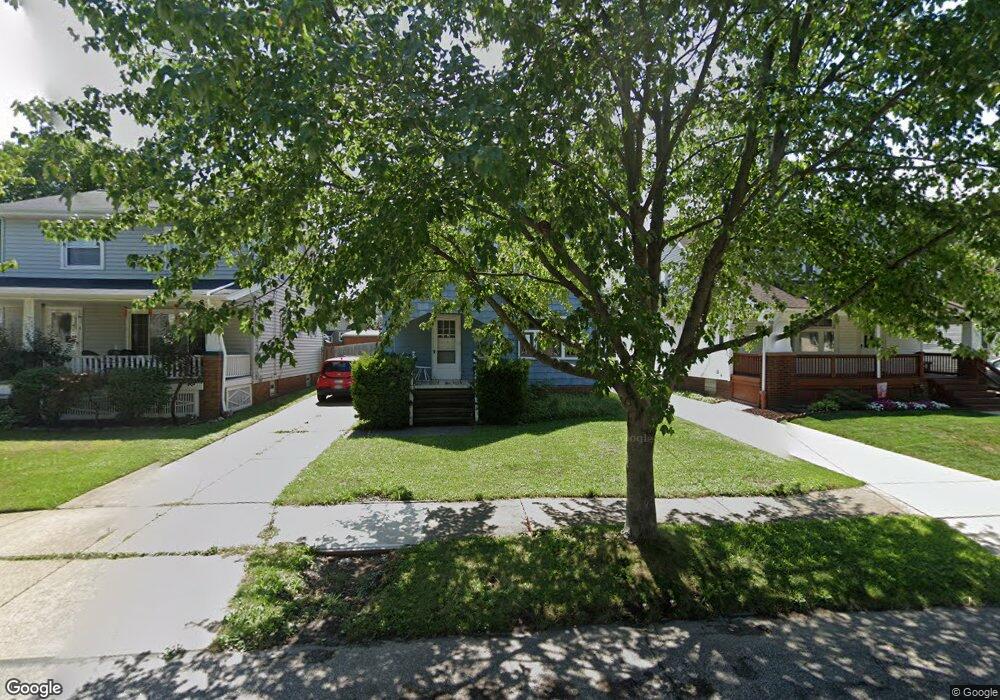
5621 Northcliff Ave Cleveland, OH 44144
Old Brooklyn NeighborhoodEstimated Value: $154,151 - $183,000
3
Beds
1
Bath
1,308
Sq Ft
$126/Sq Ft
Est. Value
About This Home
This home is located at 5621 Northcliff Ave, Cleveland, OH 44144 and is currently estimated at $165,288, approximately $126 per square foot. 5621 Northcliff Ave is a home located in Cuyahoga County with nearby schools including Benjamin Franklin, Almira Academy, and Artemus Ward School.
Ownership History
Date
Name
Owned For
Owner Type
Purchase Details
Closed on
Dec 9, 2010
Sold by
Fannie Mae
Bought by
Bobincheck Robert G
Current Estimated Value
Purchase Details
Closed on
Jul 7, 2010
Sold by
Briggs Rebecca L
Bought by
Federal National Mortgage Association
Purchase Details
Closed on
Jan 27, 2006
Sold by
Eberle Brad C and Eberle Stephanie A
Bought by
Briggs Rebecca L
Home Financials for this Owner
Home Financials are based on the most recent Mortgage that was taken out on this home.
Original Mortgage
$107,900
Interest Rate
6.46%
Mortgage Type
Fannie Mae Freddie Mac
Purchase Details
Closed on
Oct 17, 1989
Sold by
Meyers David W
Bought by
Eberle Brad C
Purchase Details
Closed on
Aug 6, 1982
Sold by
Ludwig Leisbeth J
Bought by
Meyers David W
Purchase Details
Closed on
Jan 20, 1976
Sold by
Ludwig Richard and Ludwig Liesbeth
Bought by
Ludwig Leisbeth J
Purchase Details
Closed on
Jan 1, 1975
Bought by
Ludwig Richard and Ludwig Liesbeth
Create a Home Valuation Report for This Property
The Home Valuation Report is an in-depth analysis detailing your home's value as well as a comparison with similar homes in the area
Home Values in the Area
Average Home Value in this Area
Purchase History
| Date | Buyer | Sale Price | Title Company |
|---|---|---|---|
| Bobincheck Robert G | $42,501 | Accutitle Agency | |
| Federal National Mortgage Association | $26,667 | None Available | |
| Briggs Rebecca L | $107,900 | Signature Title | |
| Eberle Brad C | $64,900 | -- | |
| Meyers David W | $33,000 | -- | |
| Ludwig Leisbeth J | -- | -- | |
| Ludwig Richard | -- | -- |
Source: Public Records
Mortgage History
| Date | Status | Borrower | Loan Amount |
|---|---|---|---|
| Previous Owner | Briggs Rebecca L | $107,900 |
Source: Public Records
Tax History Compared to Growth
Tax History
| Year | Tax Paid | Tax Assessment Tax Assessment Total Assessment is a certain percentage of the fair market value that is determined by local assessors to be the total taxable value of land and additions on the property. | Land | Improvement |
|---|---|---|---|---|
| 2024 | $3,532 | $52,815 | $10,255 | $42,560 |
| 2023 | $3,172 | $40,920 | $6,830 | $34,090 |
| 2022 | $3,154 | $40,920 | $6,830 | $34,090 |
| 2021 | $3,125 | $40,920 | $6,830 | $34,090 |
| 2020 | $2,802 | $31,710 | $5,290 | $26,430 |
| 2019 | $2,595 | $90,600 | $15,100 | $75,500 |
| 2018 | $2,598 | $31,710 | $5,290 | $26,430 |
| 2017 | $2,631 | $31,120 | $4,380 | $26,740 |
| 2016 | $2,611 | $31,120 | $4,380 | $26,740 |
| 2015 | $2,674 | $31,120 | $4,380 | $26,740 |
| 2014 | $2,674 | $31,750 | $4,480 | $27,270 |
Source: Public Records
Map
Nearby Homes
- 5901 Delora Ave
- 6025 Northcliff Ave
- 5637 Flowerdale Ave
- 5902 Vandalia Ave
- 6015 Ira Ave
- 6306 Flowerdale Ave
- 5701 Stickney Ave
- 6209 Archmere Ave
- 5714 Stickney Ave
- 6508 Delora Ave
- 4701 Burger Ave
- 4739 Ridge Rd
- 5310 Behrwald Ave
- 5105 Behrwald Ave
- 4512 Oak Park Ave
- 4506 Bader Ave
- 5406 Merkle Ave
- 4405 Bader Ave
- 5906 Velma Ave
- 5511 Velma Ave
- 5701 Northcliff Ave
- 5617 Northcliff Ave
- 5705 Northcliff Ave
- 5613 Northcliff Ave
- 5709 Northcliff Ave
- 5702 Delora Ave
- 5609 Northcliff Ave
- 5626 Delora Ave
- 5706 Delora Ave
- 5622 Delora Ave
- 5713 Northcliff Ave
- 5710 Delora Ave
- 5618 Delora Ave
- 5605 Northcliff Ave
- 5714 Delora Ave
- 5614 Delora Ave
- 5717 Northcliff Ave
- 5622 Northcliff Ave
- 5702 Northcliff Ave
- 5618 Northcliff Ave