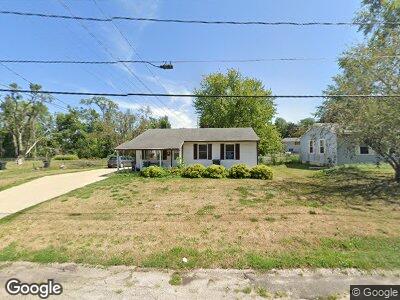
5623 Vermont St SW Cedar Rapids, IA 52404
Lincolnway Village NeighborhoodEstimated Value: $156,000 - $178,000
2
Beds
1
Bath
894
Sq Ft
$188/Sq Ft
Est. Value
About This Home
This home is located at 5623 Vermont St SW, Cedar Rapids, IA 52404 and is currently estimated at $167,876, approximately $187 per square foot. 5623 Vermont St SW is a home located in Linn County with nearby schools including Prairie Heights Elementary School, Prairie Crest Elementary School, and Prairie View Elementary School.
Ownership History
Date
Name
Owned For
Owner Type
Purchase Details
Closed on
Sep 26, 2019
Sold by
Flomo Julius J and Watkins Loretta Vakun
Bought by
Simmons Joseph and Simmons Beverly
Current Estimated Value
Home Financials for this Owner
Home Financials are based on the most recent Mortgage that was taken out on this home.
Original Mortgage
$117,826
Interest Rate
3.6%
Mortgage Type
FHA
Purchase Details
Closed on
Jun 22, 2016
Sold by
Kucera Michael
Bought by
Flomo Julius J and Watkins Loretta Vakun
Purchase Details
Closed on
Dec 29, 2005
Sold by
Barker Marlene
Bought by
Kucera Michael
Home Financials for this Owner
Home Financials are based on the most recent Mortgage that was taken out on this home.
Original Mortgage
$16,300
Interest Rate
6.34%
Mortgage Type
Credit Line Revolving
Create a Home Valuation Report for This Property
The Home Valuation Report is an in-depth analysis detailing your home's value as well as a comparison with similar homes in the area
Home Values in the Area
Average Home Value in this Area
Purchase History
| Date | Buyer | Sale Price | Title Company |
|---|---|---|---|
| Simmons Joseph | $120,000 | None Available | |
| Flomo Julius J | -- | None Available | |
| Kucera Michael | $81,000 | None Available |
Source: Public Records
Mortgage History
| Date | Status | Borrower | Loan Amount |
|---|---|---|---|
| Open | Simmons Joseph | $122,914 | |
| Closed | Simmons Joseph | $117,826 | |
| Previous Owner | Flomo Julius J | $42,000 | |
| Previous Owner | Kucera Michael R | $16,300 | |
| Previous Owner | Kucera Michael | $65,200 |
Source: Public Records
Tax History Compared to Growth
Tax History
| Year | Tax Paid | Tax Assessment Tax Assessment Total Assessment is a certain percentage of the fair market value that is determined by local assessors to be the total taxable value of land and additions on the property. | Land | Improvement |
|---|---|---|---|---|
| 2023 | $2,886 | $153,300 | $29,300 | $124,000 |
| 2022 | $2,788 | $130,300 | $25,100 | $105,200 |
| 2021 | $2,688 | $128,300 | $25,100 | $103,200 |
| 2020 | $2,688 | $118,100 | $20,900 | $97,200 |
| 2019 | $2,362 | $105,300 | $20,900 | $84,400 |
| 2018 | $2,298 | $105,300 | $20,900 | $84,400 |
| 2017 | $1,891 | $94,100 | $20,900 | $73,200 |
| 2016 | $1,891 | $87,400 | $20,900 | $66,500 |
| 2015 | $2,067 | $96,073 | $20,918 | $75,155 |
| 2014 | $1,880 | $96,073 | $20,918 | $75,155 |
| 2013 | $1,782 | $96,073 | $20,918 | $75,155 |
Source: Public Records
Map
Nearby Homes
- 5619 Ohio St SW
- 6620 Preston Terrace Ct SW
- 6701 J St SW
- 169 Kohawk
- 5060 J St SW
- 7213 Rolling Ridge Dr SW
- 4427 J St SW
- 6806 Artesa Bell Dr
- 7006 Colpepper Dr SW
- 6720 Artesa Bell Dr
- 7102 Colpepper Dr SW
- 7015 Harlan Eddy Dr SW
- 7013 Harlan Eddy Dr SW
- 7011 Harlan Eddy Dr SW
- 5901 Muirfield Dr SW Unit 4
- 6221 Muirfield Dr SW
- 7012 C St SW
- 7014 C St SW
- 5937 Muirfield Dr SW Unit 2
- Lot A-D 41st Avenue Dr SW
- 5623 Vermont St SW
- 5617 Vermont St SW
- 5629 Vermont St SW
- 5611 Vermont St SW
- 5639 Vermont St SW
- 78 Devonwood Ave SW
- 5618 Vermont St SW
- 5624 Vermont St SW
- 5612 Vermont St SW
- 5630 Vermont St SW
- 5605 Vermont St SW
- 5610 Briarwood St SW
- 5645 Vermont St SW
- 5606 Vermont St SW
- 76 Devonwood Ave SW
- 5640 Vermont St SW
- 5620 Briarwood St SW
- 5651 Vermont St SW
- 5601 Vermont St SW
- 5621 Colorado Dr SW