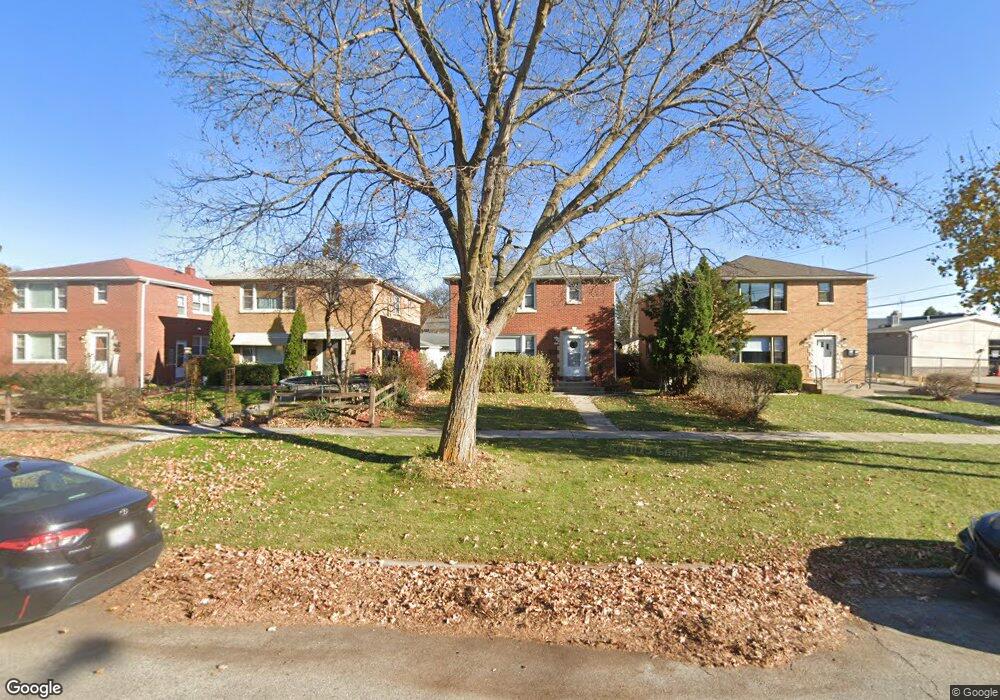
5626 N 27th St Milwaukee, WI 53209
Thurston Woods NeighborhoodEstimated Value: $194,000 - $285,939
5
Beds
2
Baths
2,180
Sq Ft
$103/Sq Ft
Est. Value
About This Home
This home is located at 5626 N 27th St, Milwaukee, WI 53209 and is currently estimated at $224,235, approximately $102 per square foot. 5626 N 27th St is a home located in Milwaukee County with nearby schools including Southeast Learning Center, Walnut Grove Elementary School, and Willow Lake Elementary School.
Ownership History
Date
Name
Owned For
Owner Type
Purchase Details
Closed on
Feb 27, 2019
Sold by
Riedel Jerry and Olson Riedel Sandra
Bought by
Chay Nathapong and Chay Maria
Current Estimated Value
Home Financials for this Owner
Home Financials are based on the most recent Mortgage that was taken out on this home.
Original Mortgage
$90,300
Outstanding Balance
$79,389
Interest Rate
4.4%
Mortgage Type
New Conventional
Estimated Equity
$144,846
Purchase Details
Closed on
Oct 17, 2008
Sold by
Kuritz Damon James and Thompson Barbara F
Bought by
Riedel Jerry and Olson Riedel Sandra
Purchase Details
Closed on
Mar 7, 2008
Sold by
Kuritz Frances and Kuritz Damon James
Bought by
Kuritz Damon James and Thompson Barbara F
Purchase Details
Closed on
Dec 11, 1997
Sold by
Kuritz Frances
Bought by
Kuritz James Damon and Kuritz Damon James
Create a Home Valuation Report for This Property
The Home Valuation Report is an in-depth analysis detailing your home's value as well as a comparison with similar homes in the area
Home Values in the Area
Average Home Value in this Area
Purchase History
| Date | Buyer | Sale Price | Title Company |
|---|---|---|---|
| Chay Nathapong | $113,000 | None Available | |
| Riedel Jerry | $112,000 | None Available | |
| Kuritz Damon James | -- | None Available | |
| Kuritz James Damon | $16,800 | -- |
Source: Public Records
Mortgage History
| Date | Status | Borrower | Loan Amount |
|---|---|---|---|
| Open | Chay Nathapong | $90,300 |
Source: Public Records
Tax History Compared to Growth
Tax History
| Year | Tax Paid | Tax Assessment Tax Assessment Total Assessment is a certain percentage of the fair market value that is determined by local assessors to be the total taxable value of land and additions on the property. | Land | Improvement |
|---|---|---|---|---|
| 2024 | $3,946 | $175,900 | $3,100 | $172,800 |
| 2023 | $3,422 | $144,800 | $3,100 | $141,700 |
| 2022 | $3,375 | $144,800 | $3,100 | $141,700 |
| 2021 | $2,970 | $115,700 | $4,100 | $111,600 |
| 2020 | $2,953 | $115,700 | $4,100 | $111,600 |
| 2019 | $2,325 | $78,500 | $4,000 | $74,500 |
| 2018 | $1,964 | $78,500 | $4,000 | $74,500 |
| 2017 | $2,069 | $78,500 | $5,800 | $72,700 |
| 2016 | $2,160 | $77,900 | $5,800 | $72,100 |
| 2015 | $2,124 | $75,100 | $5,800 | $69,300 |
| 2014 | $2,171 | $75,100 | $5,800 | $69,300 |
| 2013 | -- | $75,100 | $5,800 | $69,300 |
Source: Public Records
Map
Nearby Homes
- 5506 N 26th St
- 5756 N Argyle Ave
- 5607 N Argyle Ave
- 5404 N Bethmaur Ln
- 2335 W Marne Ave
- 2230 W Neil Place
- 5565 N 32nd St
- 2220 W Neil Place
- 5342 N 26th St
- 5549 N 33rd St
- 2336 W Lawn Ave
- 5506 N 34th St
- 5509 N 20th St
- 5246 N 26th St
- 5527 N 34th St
- 2328 W Rohr Ave
- 5673 N 35th St
- 5629 N 35th St
- 5355 N 33rd St
- 5810 N Green Bay Ave
- 5630 N 27th St Unit 5632
- 5618 N 27th St Unit 5620
- 5636 N 27th St Unit 5638
- 5640 N 27th St Unit 5642
- 5625 N Braeburn Ln
- 5637 N Braeburn Ln
- 5629 N Braeburn Ln Unit 5631
- 5646 N 27th St
- 5641 N Braeburn Ln
- 5652 N 27th St
- 5645 N Braeburn Ln
- 5627 N 27th St
- 5633 N 27th St
- 5658 N 27th St
- 5651 N Braeburn Ln
- 5655 N 27th St
- 5662 N 27th St
- 5659 N 27th St
- 5663 N Braeburn Ln
- 5622 N Braeburn Ln