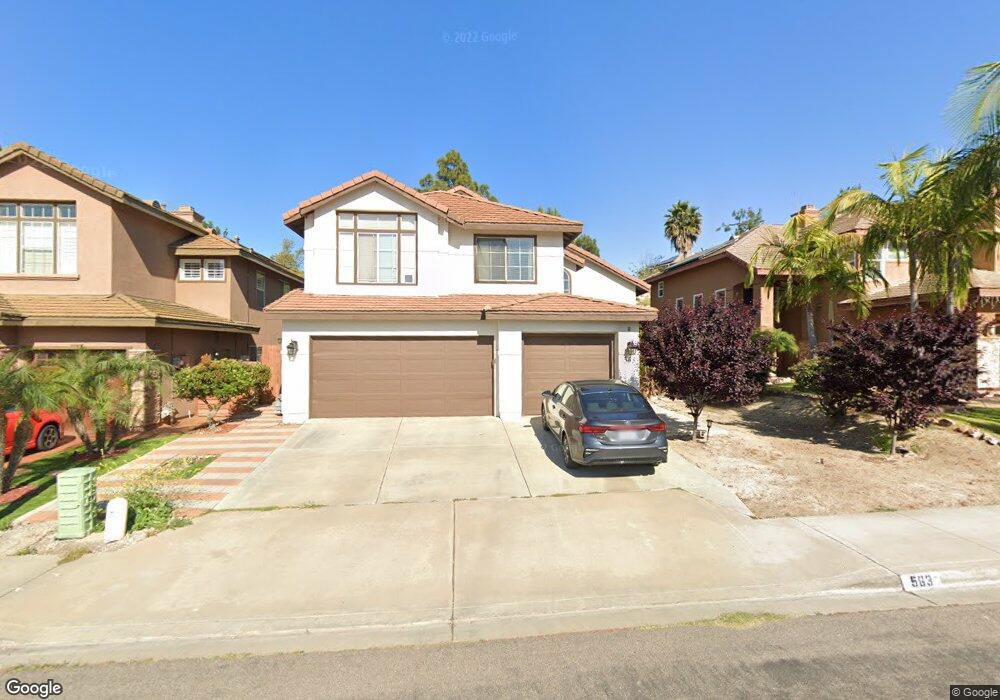
563 Bayona Loop Chula Vista, CA 91910
Rancho Del Rey NeighborhoodEstimated Value: $1,094,342 - $1,220,000
4
Beds
3
Baths
2,381
Sq Ft
$491/Sq Ft
Est. Value
About This Home
This home is located at 563 Bayona Loop, Chula Vista, CA 91910 and is currently estimated at $1,169,836, approximately $491 per square foot. 563 Bayona Loop is a home located in San Diego County with nearby schools including Bonita Vista Middle School, Bonita Vista Senior High School, and Discovery Charter School.
Ownership History
Date
Name
Owned For
Owner Type
Purchase Details
Closed on
Dec 20, 2019
Sold by
Nevarez Irma Yolanda
Bought by
Nevarez Irma Y and Orso Nevarez Isabella L
Current Estimated Value
Home Financials for this Owner
Home Financials are based on the most recent Mortgage that was taken out on this home.
Original Mortgage
$395,900
Outstanding Balance
$349,725
Interest Rate
3.7%
Mortgage Type
New Conventional
Estimated Equity
$820,111
Purchase Details
Closed on
Jan 19, 2011
Sold by
Orso Delgado Pedro
Bought by
Nevarez Irma Yolanda and Nevarez Orso Irma Y
Purchase Details
Closed on
Jul 18, 2002
Sold by
Hansen Jon M and Hansen Lauren R
Bought by
Orso Delgado Pedro and Nevarez Orso Irma Y
Home Financials for this Owner
Home Financials are based on the most recent Mortgage that was taken out on this home.
Original Mortgage
$356,000
Interest Rate
6.52%
Purchase Details
Closed on
Jul 1, 1996
Sold by
Shea Homes Limited Partnership
Bought by
Hansen Jon M and Hansen Lauren R
Home Financials for this Owner
Home Financials are based on the most recent Mortgage that was taken out on this home.
Original Mortgage
$207,000
Interest Rate
8.39%
Mortgage Type
Balloon
Create a Home Valuation Report for This Property
The Home Valuation Report is an in-depth analysis detailing your home's value as well as a comparison with similar homes in the area
Home Values in the Area
Average Home Value in this Area
Purchase History
| Date | Buyer | Sale Price | Title Company |
|---|---|---|---|
| Nevarez Irma Y | -- | First American Title | |
| Nevarez Irma Yolanda | -- | None Available | |
| Orso Delgado Pedro | $445,000 | First American Title Co | |
| Hansen Jon M | $235,500 | Chicago Title Co |
Source: Public Records
Mortgage History
| Date | Status | Borrower | Loan Amount |
|---|---|---|---|
| Open | Nevarez Irma Y | $395,900 | |
| Previous Owner | Orso Delgado Pedro | $356,000 | |
| Previous Owner | Hansen Jon M | $207,000 |
Source: Public Records
Tax History
| Year | Tax Paid | Tax Assessment Tax Assessment Total Assessment is a certain percentage of the fair market value that is determined by local assessors to be the total taxable value of land and additions on the property. | Land | Improvement |
|---|---|---|---|---|
| 2025 | $7,803 | $644,484 | $188,274 | $456,210 |
| 2024 | $7,803 | $631,848 | $184,583 | $447,265 |
| 2023 | $7,663 | $619,460 | $180,964 | $438,496 |
| 2022 | $7,441 | $607,315 | $177,416 | $429,899 |
| 2021 | $7,272 | $595,408 | $173,938 | $421,470 |
| 2020 | $7,108 | $589,304 | $172,155 | $417,149 |
| 2019 | $8,407 | $577,750 | $168,780 | $408,970 |
| 2018 | $8,326 | $566,422 | $165,471 | $400,951 |
| 2017 | $8,173 | $555,317 | $162,227 | $393,090 |
| 2016 | $7,939 | $544,430 | $159,047 | $385,383 |
| 2015 | $7,542 | $520,000 | $151,000 | $369,000 |
| 2014 | $7,530 | $520,000 | $151,000 | $369,000 |
Source: Public Records
Map
Nearby Homes
- 1053 Ardilla Place
- 1006 Acero St
- 728 Cardona Ave
- 737 Duoro Dr
- 884 Lagasca Place
- 406 Milagrosa Cir
- 408 Milagrosa Cir
- 1349 Ridgeview Way
- 927 Rawhide Ct
- 240 Camino Del Cerro Grande
- 1386 Serena Cir Unit 1
- 363 Surrey Dr
- 1415 Summit Dr
- 1302 Valencia Loop
- 743 Terra Nova Dr
- 4020 Tim St
- 1390 Valencia Loop
- 0 0 Unit 62
- 919 Caminito Estrella
- 1430 Country Vistas Ln
- 565 Bayona Loop
- 561 Bayona Loop
- 567 Bayona Loop
- 559 Bayona Loop
- 1106 Los Indios Ct
- 557 Bayona Loop
- 1107 Los Indios Ct
- 579 Bayona Loop
- 1101 Corrales Ln
- 1097 Espuelas Ct
- 1104 Los Indios Ct
- 1100 Corrales Ln
- 555 Bayona Loop
- 581 Bayona Loop
- 1105 Corrales Ln
- 1095 Espuelas Ct
- 1100 Calle Florecita
- 1105 Los Indios Ct
- 1096 Espuelas Ct
- 1102 Los Indios Ct
Your Personal Tour Guide
Ask me questions while you tour the home.