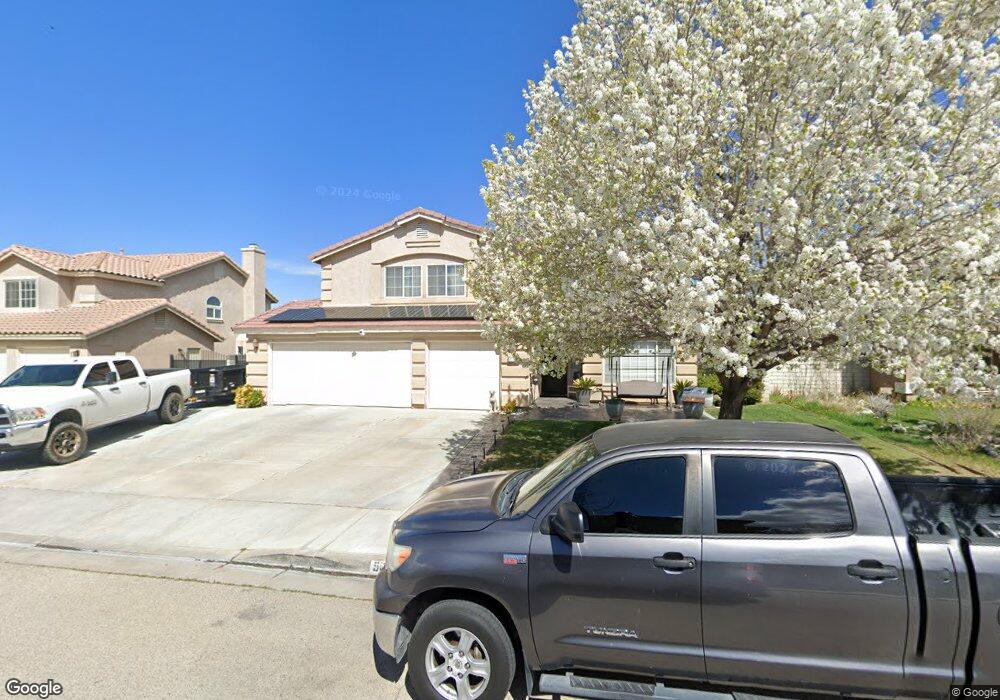
5633 E Avenue r12 Palmdale, CA 93552
East Palmdale NeighborhoodEstimated Value: $567,587 - $604,000
4
Beds
3
Baths
3,111
Sq Ft
$187/Sq Ft
Est. Value
About This Home
This home is located at 5633 E Avenue r12, Palmdale, CA 93552 and is currently estimated at $582,647, approximately $187 per square foot. 5633 E Avenue r12 is a home located in Los Angeles County with nearby schools including Quail Valley Elementary School, Shadow Hills Middle School, and Knight High School.
Ownership History
Date
Name
Owned For
Owner Type
Purchase Details
Closed on
Aug 30, 2010
Sold by
Hobdy Sammy and Hobdy Deloris Jean
Bought by
Walker Deborah
Current Estimated Value
Home Financials for this Owner
Home Financials are based on the most recent Mortgage that was taken out on this home.
Original Mortgage
$182,541
Outstanding Balance
$126,847
Interest Rate
5.5%
Mortgage Type
FHA
Estimated Equity
$455,800
Purchase Details
Closed on
May 14, 2004
Sold by
Hobdy Sammy and Hobdy Deloris
Bought by
Hobdy Sammy
Home Financials for this Owner
Home Financials are based on the most recent Mortgage that was taken out on this home.
Original Mortgage
$134,000
Interest Rate
6.05%
Mortgage Type
Purchase Money Mortgage
Purchase Details
Closed on
Aug 19, 2002
Sold by
Socal Housing Partners Llc
Bought by
Hobdy Sammy
Home Financials for this Owner
Home Financials are based on the most recent Mortgage that was taken out on this home.
Original Mortgage
$70,000
Interest Rate
6.62%
Create a Home Valuation Report for This Property
The Home Valuation Report is an in-depth analysis detailing your home's value as well as a comparison with similar homes in the area
Home Values in the Area
Average Home Value in this Area
Purchase History
| Date | Buyer | Sale Price | Title Company |
|---|---|---|---|
| Walker Deborah | $185,000 | Fidelity Van Nuys | |
| Hobdy Sammy | -- | First American Title Co | |
| Hobdy Sammy | $226,500 | Fidelity Natl Title Ins Co |
Source: Public Records
Mortgage History
| Date | Status | Borrower | Loan Amount |
|---|---|---|---|
| Open | Walker Deborah | $182,541 | |
| Previous Owner | Hobdy Sammy | $134,000 | |
| Previous Owner | Hobdy Sammy | $70,000 |
Source: Public Records
Tax History Compared to Growth
Tax History
| Year | Tax Paid | Tax Assessment Tax Assessment Total Assessment is a certain percentage of the fair market value that is determined by local assessors to be the total taxable value of land and additions on the property. | Land | Improvement |
|---|---|---|---|---|
| 2025 | $5,578 | $237,002 | $47,395 | $189,607 |
| 2024 | $5,578 | $232,356 | $46,466 | $185,890 |
| 2023 | $5,515 | $227,801 | $45,555 | $182,246 |
| 2022 | $5,334 | $223,335 | $44,662 | $178,673 |
| 2021 | $5,204 | $218,957 | $43,787 | $175,170 |
| 2019 | $5,038 | $212,465 | $42,490 | $169,975 |
| 2018 | $4,957 | $208,300 | $41,657 | $166,643 |
| 2016 | $4,645 | $200,214 | $40,041 | $160,173 |
| 2015 | $4,595 | $197,208 | $39,440 | $157,768 |
| 2014 | $4,538 | $193,346 | $38,668 | $154,678 |
Source: Public Records
Map
Nearby Homes
- 5715 Malaga Ct
- 5630 E Avenue r11
- 5602 E Avenue r11
- 5564 Capri Ct
- 37453 56th St E
- 5767 E Avenue R 11
- 37223 Segovia Way
- 37152 57th St E
- 5361 E Avenue R 12
- 37222 55th St E
- 0 East Ave S Unit SB24240336
- 37104 57th St E
- 37304 Sabal Ave
- 5538 Katrina Place
- 37230 Sabal Ave
- 37530 Arbor Ln
- 52 Vic Avenue T12 Vic
- 0 Apn: 3051-020-020 Unit SR25175844
- 0 E Ave M Drt Vic 73rd St E Unit SR25077456
- 0 Ave M Vic Antelope Hwy Unit SR25039300
- 5639 E Avenue r12
- 5625 E Avenue r12
- 5625 E Avenue R 12
- 5622 E Avenue r11
- 5636 E Avenue r11
- 5622 E Avenue r11
- 5617 E Avenue r12
- 5647 E Avenue r12
- 37355 Del Mar St
- 5642 E Avenue r11
- 5616 E Avenue r11
- 5624 E Avenue r12
- 5611 E Avenue r12
- 5653 E Avenue r12
- 37349 Del Mar St
- 37356 Del Mar St
- 5650 E Avenue r11
- 5610 E Avenue r11
- 5627 E Avenue r11