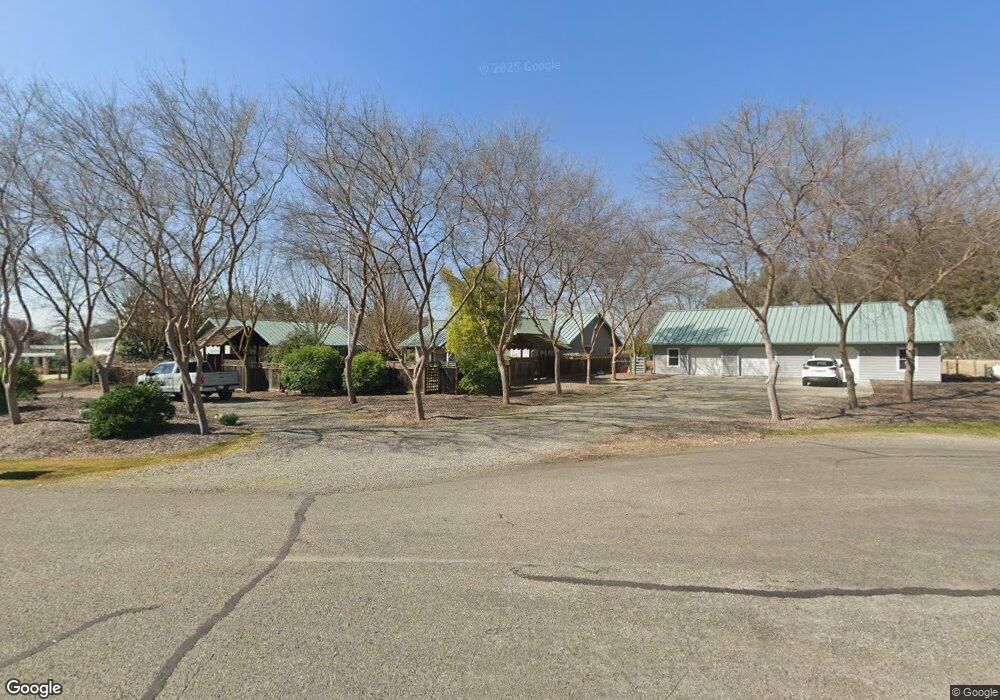
5633 N Wright Ave Clovis, CA 93619
Estimated Value: $647,000 - $849,000
3
Beds
4
Baths
2,444
Sq Ft
$310/Sq Ft
Est. Value
About This Home
This home is located at 5633 N Wright Ave, Clovis, CA 93619 and is currently estimated at $756,620, approximately $309 per square foot. 5633 N Wright Ave is a home located in Fresno County with nearby schools including Cedarwood Elementary School, Clark Intermediate School, and Clovis High School.
Ownership History
Date
Name
Owned For
Owner Type
Purchase Details
Closed on
Jun 11, 2025
Sold by
Harrison David
Bought by
David J Harrison Revocable Living Trust and Harrison
Current Estimated Value
Purchase Details
Closed on
Sep 22, 2014
Sold by
Harrison David
Bought by
Harrison David J
Purchase Details
Closed on
Dec 21, 2007
Sold by
Mead Richard M and Harrison Diane R
Bought by
Mead Richard M and Harrison Diane R
Purchase Details
Closed on
Aug 15, 2000
Sold by
Nisbett Billy M and Nisbett Sharron
Bought by
Harrison David and Mead Richard
Home Financials for this Owner
Home Financials are based on the most recent Mortgage that was taken out on this home.
Original Mortgage
$56,250
Interest Rate
7.82%
Mortgage Type
Balloon
Purchase Details
Closed on
Nov 22, 1993
Sold by
Yazdi Mark and Yazdi Eugenia N
Bought by
Nisbett Billy M and Nisbett Sharron
Create a Home Valuation Report for This Property
The Home Valuation Report is an in-depth analysis detailing your home's value as well as a comparison with similar homes in the area
Purchase History
| Date | Buyer | Sale Price | Title Company |
|---|---|---|---|
| David J Harrison Revocable Living Trust | -- | None Listed On Document | |
| Harrison David J | -- | None Available | |
| Mead Richard M | -- | None Available | |
| Mead Richard M | -- | None Available | |
| Harrison David | $75,000 | Chicago Title Co | |
| Nisbett Billy M | -- | Central Title Company | |
| Nisbett Billy M | $80,000 | Central Title Company |
Source: Public Records
Mortgage History
| Date | Status | Borrower | Loan Amount |
|---|---|---|---|
| Previous Owner | Harrison David | $56,250 |
Source: Public Records
Tax History
| Year | Tax Paid | Tax Assessment Tax Assessment Total Assessment is a certain percentage of the fair market value that is determined by local assessors to be the total taxable value of land and additions on the property. | Land | Improvement |
|---|---|---|---|---|
| 2025 | $6,338 | $495,317 | $113,001 | $382,316 |
| 2023 | $6,209 | $476,085 | $108,614 | $367,471 |
| 2022 | $5,932 | $466,751 | $106,485 | $360,266 |
| 2021 | $5,762 | $457,600 | $104,398 | $353,202 |
| 2020 | $5,725 | $452,909 | $103,328 | $349,581 |
| 2019 | $5,606 | $444,029 | $101,302 | $342,727 |
| 2018 | $5,455 | $433,500 | $102,000 | $331,500 |
| 2017 | $5,353 | $425,000 | $100,000 | $325,000 |
| 2016 | $5,142 | $414,932 | $169,851 | $245,081 |
| 2015 | $5,057 | $408,700 | $167,300 | $241,400 |
| 2014 | $4,750 | $382,800 | $156,700 | $226,100 |
Source: Public Records
Map
Nearby Homes
- 9321 E Bullard Ave
- 1437 Las Rosas Ave
- 1040 San Marino Ave
- 4148 Beverly Ave
- 1006 La Canada Ave
- 4080 San Jose Ave
- 4187 Poe Ave
- 1667 Las Rosas Ave
- 637 Soledad Ave
- 10595 E San Felipe Ave
- 4103 Keats Ave
- 4245 Fairmont Ave
- 1100 Corazon Ave
- 1811 Agua Dulce Ave
- 4158 Duncan Ave
- 3919 Portals Ave
- 4234 Alamos Ave
- 10455 E Greenbury Way
- 3833 Hannah Ln
- 4161 Alamos Ave
- 5605 N Wright Ave
- 5634 N Wright Ave
- 5672 N Wright Ave
- 5596 N Wright Ave
- 9601 E Bullard Ave
- 5632 N Thompson Ave
- 5604 N Thompson Ave
- 5559 N Wright Ave
- 5550 N Wright Ave
- 5558 N Thompson Ave
- 9555 E Bullard Ave
- 9700 E Barstow Ave
- 5631 N Thompson Ave
- 9603 E Bullard Ave
- 5603 N Thompson Ave
- 9744 E Barstow Ave
- 5557 N Thompson Ave
- 5477 N Mccall Ave
- 9755 E Bullard Ave
- 9836 E Barstow Ave
Your Personal Tour Guide
Ask me questions while you tour the home.