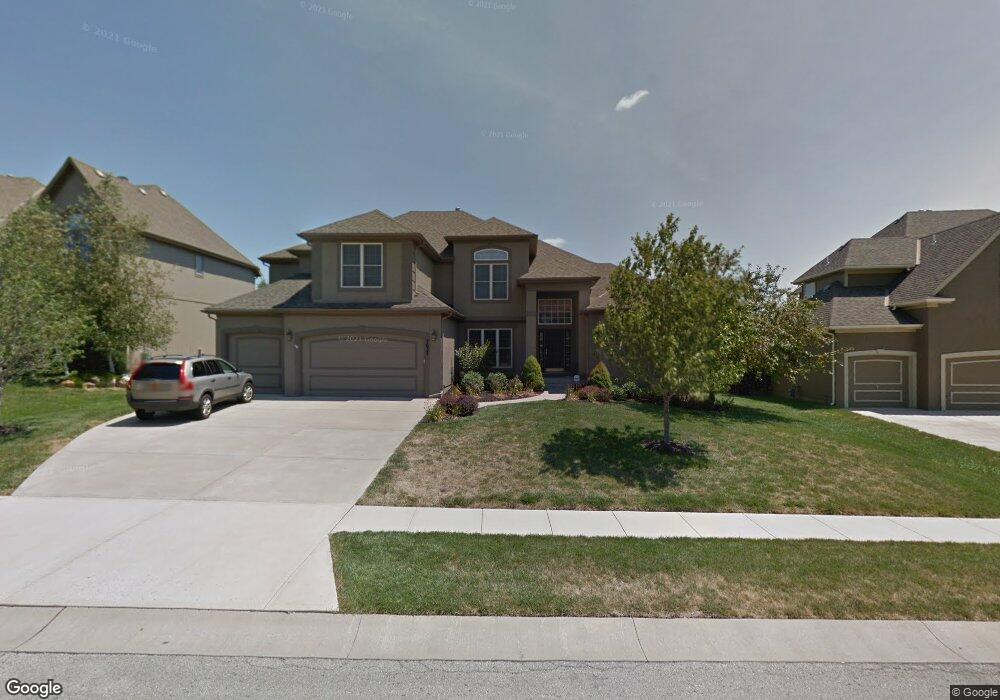
5633 Roundtree St Shawnee, KS 66226
Estimated Value: $628,209 - $686,000
4
Beds
4
Baths
3,348
Sq Ft
$196/Sq Ft
Est. Value
About This Home
This home is located at 5633 Roundtree St, Shawnee, KS 66226 and is currently estimated at $657,052, approximately $196 per square foot. 5633 Roundtree St is a home located in Johnson County with nearby schools including Prairie Ridge Elementary School, Monticello Trails Middle School, and Mill Valley High School.
Ownership History
Date
Name
Owned For
Owner Type
Purchase Details
Closed on
Jun 23, 2008
Sold by
Fincham Kent A and Fincham Amy M
Bought by
Fincham Kent A and Fincham Amy M
Current Estimated Value
Home Financials for this Owner
Home Financials are based on the most recent Mortgage that was taken out on this home.
Original Mortgage
$335,000
Outstanding Balance
$210,533
Interest Rate
5.99%
Mortgage Type
New Conventional
Estimated Equity
$446,519
Purchase Details
Closed on
Apr 8, 2005
Sold by
Rounbehler Construction Inc
Bought by
Fincham Kent A
Home Financials for this Owner
Home Financials are based on the most recent Mortgage that was taken out on this home.
Original Mortgage
$326,400
Interest Rate
5.62%
Mortgage Type
Adjustable Rate Mortgage/ARM
Purchase Details
Closed on
Apr 27, 2003
Sold by
Rodrock Homes Inc
Bought by
Rounbehler Construction Inc
Home Financials for this Owner
Home Financials are based on the most recent Mortgage that was taken out on this home.
Original Mortgage
$322,800
Interest Rate
5.57%
Create a Home Valuation Report for This Property
The Home Valuation Report is an in-depth analysis detailing your home's value as well as a comparison with similar homes in the area
Home Values in the Area
Average Home Value in this Area
Purchase History
| Date | Buyer | Sale Price | Title Company |
|---|---|---|---|
| Fincham Kent A | -- | First United Title Ag | |
| Fincham Kent A | -- | First American Title | |
| Rounbehler Construction Inc | -- | Security Land Title Company |
Source: Public Records
Mortgage History
| Date | Status | Borrower | Loan Amount |
|---|---|---|---|
| Open | Fincham Kent A | $335,000 | |
| Closed | Fincham Kent A | $326,400 | |
| Closed | Fincham Kent A | $81,600 | |
| Previous Owner | Rounbehler Construction Inc | $322,800 |
Source: Public Records
Tax History
| Year | Tax Paid | Tax Assessment Tax Assessment Total Assessment is a certain percentage of the fair market value that is determined by local assessors to be the total taxable value of land and additions on the property. | Land | Improvement |
|---|---|---|---|---|
| 2025 | $7,199 | $61,203 | $13,496 | $47,707 |
| 2023 | $7,242 | $61,525 | $13,307 | $48,218 |
| 2022 | $6,880 | $57,270 | $12,667 | $44,603 |
| 2021 | $6,639 | $53,256 | $11,516 | $41,740 |
| 2020 | $6,104 | $48,507 | $11,516 | $36,991 |
| 2019 | $6,137 | $48,058 | $10,037 | $38,021 |
| 2018 | $6,123 | $47,530 | $9,128 | $38,402 |
| 2017 | $6,216 | $47,081 | $7,935 | $39,146 |
| 2016 | $6,533 | $48,887 | $7,935 | $40,952 |
| 2015 | $6,540 | $47,955 | $7,935 | $40,020 |
| 2013 | -- | $45,414 | $7,935 | $37,479 |
Source: Public Records
Map
Nearby Homes
- 22218 W 57th St
- 5511 Chouteau St
- 5333 Hilltop Dr
- 21606 W 57th Terrace
- 5314 Brockway St
- 24621 W 60th St
- 24612 W 60th St
- 21316 W 58th St
- 5815 Lakecrest Dr
- 21605 W 60th Terrace
- 21710 W 62nd St
- 5619 Theden St
- 21613 W 61st St
- 21526 W 51st Terrace
- 21010 W 54th St
- 20907 W 53rd Terrace
- 6013 Longview Rd
- 5660 Meadow Heights Dr
- 6047 Theden St
- 5837 Millbrook St
- 5629 Roundtree St
- 5637 Roundtree St
- 22111 W 57th Terrace
- 22110 W 57th Terrace
- 5625 Roundtree St
- 5634 Roundtree St
- 5641 Roundtree St
- 5630 Roundtree St
- 22107 W 57th Terrace
- 5638 Roundtree St
- 5626 Roundtree St
- 22106 W 57th Terrace
- 5621 Roundtree St
- 5620 Roundtree St
- 22103 W 57th Terrace
- 5617 Roundtree St
- 5628 Brockway St
- 22205 W 57th St
- 22224 W 57th St
- 22201 W 57th St
Your Personal Tour Guide
Ask me questions while you tour the home.