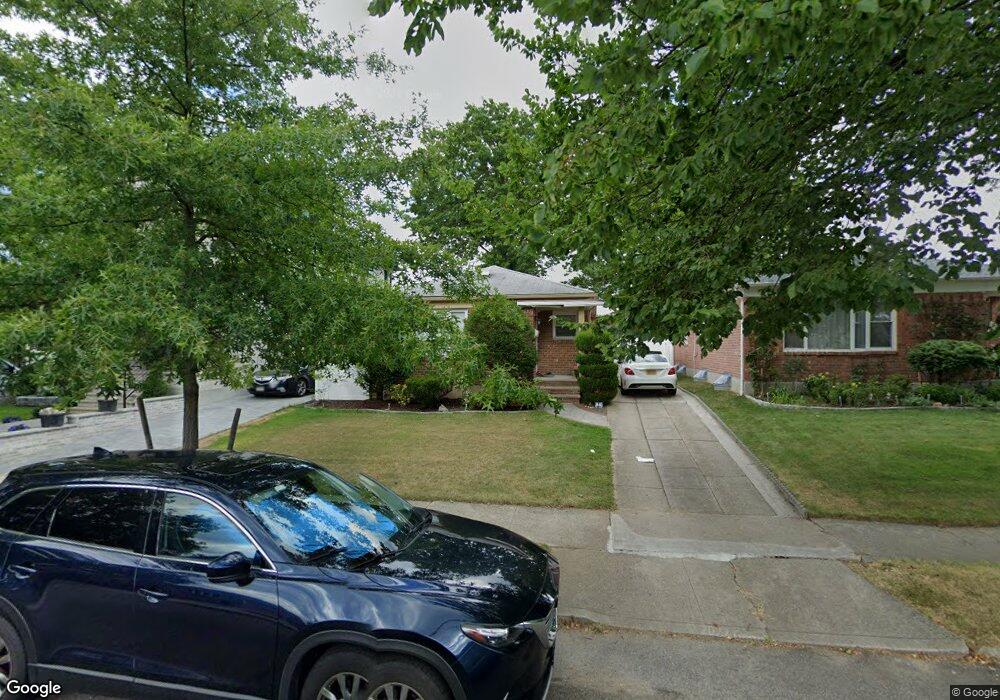
5635 218th St Flushing, NY 11364
Bayside NeighborhoodEstimated Value: $1,018,000 - $1,277,000
Studio
--
Bath
1,068
Sq Ft
$1,042/Sq Ft
Est. Value
About This Home
This home is located at 5635 218th St, Flushing, NY 11364 and is currently estimated at $1,112,973, approximately $1,042 per square foot. 5635 218th St is a home located in Queens County with nearby schools including P.S. 203 - Oakland Gardens, Nathaniel Hawthorne Middle School 74, and Benjamin N Cardozo High School.
Ownership History
Date
Name
Owned For
Owner Type
Purchase Details
Closed on
Dec 2, 2024
Sold by
Xu Rong and Xu Zelin
Bought by
Tang Shile and Xu Zelin
Current Estimated Value
Purchase Details
Closed on
Aug 30, 2017
Sold by
Zheng Jie and Zhou Ming
Bought by
Xu Rong and Xu Zelin
Home Financials for this Owner
Home Financials are based on the most recent Mortgage that was taken out on this home.
Original Mortgage
$525,000
Outstanding Balance
$436,665
Interest Rate
3.93%
Mortgage Type
New Conventional
Estimated Equity
$676,308
Purchase Details
Closed on
Jan 19, 2017
Sold by
Costanza Denise Chayet and Costanza Robert T
Bought by
Zheng Jie and Zhou Ming
Purchase Details
Closed on
Jul 24, 1997
Sold by
Kleinman Joel and Kleinman Bertha
Bought by
Costanza Robert T and Costanza Denise Chayet
Home Financials for this Owner
Home Financials are based on the most recent Mortgage that was taken out on this home.
Original Mortgage
$185,600
Interest Rate
7.47%
Create a Home Valuation Report for This Property
The Home Valuation Report is an in-depth analysis detailing your home's value as well as a comparison with similar homes in the area
Home Values in the Area
Average Home Value in this Area
Purchase History
| Date | Buyer | Sale Price | Title Company |
|---|---|---|---|
| Tang Shile | -- | -- | |
| Xu Rong | $750,000 | -- | |
| Xu Rong | $750,000 | -- | |
| Xu Rong | $750,000 | -- | |
| Zheng Jie | $720,000 | -- | |
| Zheng Jie | $720,000 | -- | |
| Costanza Robert T | $232,000 | Commonwealth Land Title Ins | |
| Costanza Robert T | $232,000 | Commonwealth Land Title Ins |
Source: Public Records
Mortgage History
| Date | Status | Borrower | Loan Amount |
|---|---|---|---|
| Open | Xu Rong | $525,000 | |
| Closed | Xu Rong | $525,000 | |
| Previous Owner | Costanza Robert T | $185,600 |
Source: Public Records
Tax History
| Year | Tax Paid | Tax Assessment Tax Assessment Total Assessment is a certain percentage of the fair market value that is determined by local assessors to be the total taxable value of land and additions on the property. | Land | Improvement |
|---|---|---|---|---|
| 2025 | $10,595 | $53,028 | $11,969 | $41,059 |
| 2024 | $10,595 | $52,751 | $12,783 | $39,968 |
| 2023 | $9,996 | $49,766 | $12,085 | $37,681 |
| 2022 | $9,418 | $58,860 | $14,220 | $44,640 |
| 2021 | $9,858 | $58,680 | $14,220 | $44,460 |
| 2020 | $9,354 | $54,180 | $14,220 | $39,960 |
| 2019 | $9,196 | $54,780 | $14,220 | $40,560 |
| 2018 | $8,454 | $41,472 | $11,785 | $29,687 |
| 2017 | $8,014 | $39,314 | $11,560 | $27,754 |
| 2016 | $7,803 | $39,314 | $11,560 | $27,754 |
| 2015 | $4,253 | $36,825 | $12,417 | $24,408 |
| 2014 | $4,253 | $36,633 | $14,294 | $22,339 |
Source: Public Records
Map
Nearby Homes
- 5631 219th St
- 5648 219th St
- 5636 213th St
- 5612 212th St
- 224-39 Kingsbury ave Kingsbury Ave Unit A
- 224-01 59th Ave
- 219-36 64th Ave
- 219-02 64th Ave Unit 3
- 61-51 Springfield Blvd
- 216-17 48th Ave Unit 2B
- 50-05 212th St
- 5627 210th St
- 22030 64th Ave Unit 2Fl.
- 215-43 48th Ave Unit 3A
- 215-43 48th Ave Unit 3B
- 57-53 225th St
- 224-08 Horace Harding Expy Unit Lower
- 47-15 216th St Unit 3D
- 47-27 215th Place Unit 1A
- 58-07 210th St
Your Personal Tour Guide
Ask me questions while you tour the home.