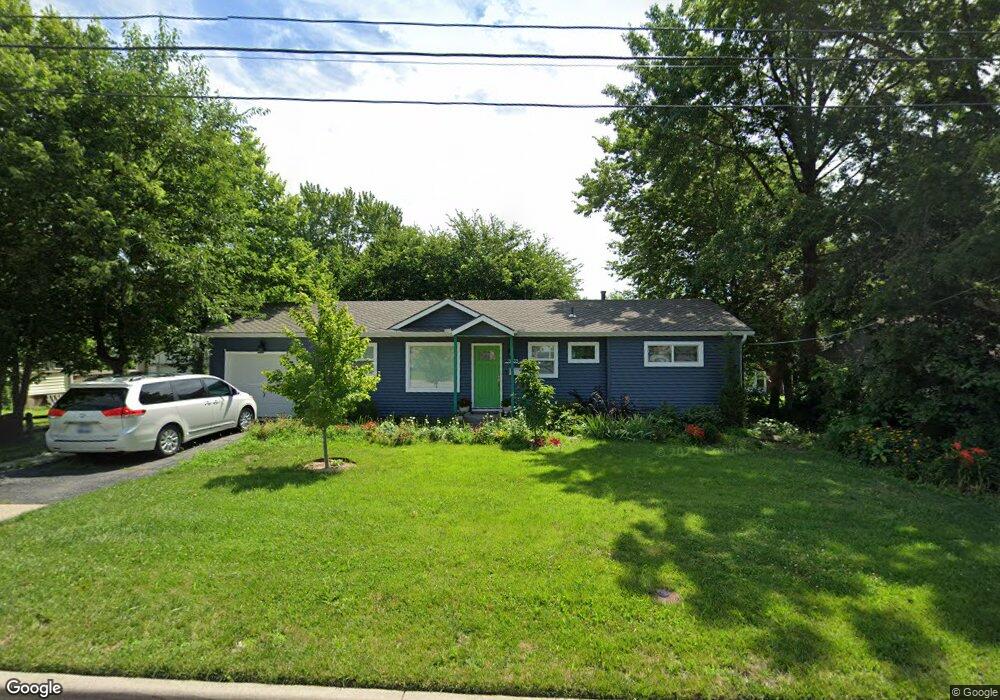
5635 Rosehill Rd Shawnee, KS 66216
Estimated Value: $286,000 - $310,000
3
Beds
3
Baths
1,069
Sq Ft
$274/Sq Ft
Est. Value
About This Home
This home is located at 5635 Rosehill Rd, Shawnee, KS 66216 and is currently estimated at $293,325, approximately $274 per square foot. 5635 Rosehill Rd is a home located in Johnson County with nearby schools including Ray Marsh Elementary School, Trailridge Middle School, and Shawnee Mission Northwest High School.
Ownership History
Date
Name
Owned For
Owner Type
Purchase Details
Closed on
Jun 15, 2022
Sold by
David Barr
Bought by
Ferguson Courtney D
Current Estimated Value
Purchase Details
Closed on
Jun 10, 2022
Sold by
Ferguson Courtney D
Bought by
Ferguson Courtney D and Ferguson Byron S
Purchase Details
Closed on
Mar 22, 2021
Sold by
Barr David and Barr David H
Bought by
Barr David and Barr David H
Purchase Details
Closed on
Nov 25, 2008
Sold by
Hamilton Robert L
Bought by
Barr Shirley A and Barr David
Home Financials for this Owner
Home Financials are based on the most recent Mortgage that was taken out on this home.
Original Mortgage
$74,594
Interest Rate
6.48%
Mortgage Type
FHA
Create a Home Valuation Report for This Property
The Home Valuation Report is an in-depth analysis detailing your home's value as well as a comparison with similar homes in the area
Home Values in the Area
Average Home Value in this Area
Purchase History
| Date | Buyer | Sale Price | Title Company |
|---|---|---|---|
| Ferguson Courtney D | -- | None Listed On Document | |
| Ferguson Courtney D | -- | None Listed On Document | |
| Ferguson Courtney D | -- | None Listed On Document | |
| Barr David | -- | None Listed On Document | |
| Barr Shirley A | -- | Stewart Title Of Kansas City |
Source: Public Records
Mortgage History
| Date | Status | Borrower | Loan Amount |
|---|---|---|---|
| Previous Owner | Barr Shirley A | $74,594 |
Source: Public Records
Tax History Compared to Growth
Tax History
| Year | Tax Paid | Tax Assessment Tax Assessment Total Assessment is a certain percentage of the fair market value that is determined by local assessors to be the total taxable value of land and additions on the property. | Land | Improvement |
|---|---|---|---|---|
| 2024 | $2,949 | $28,152 | $5,130 | $23,022 |
| 2023 | $3,013 | $28,163 | $5,130 | $23,033 |
| 2022 | $2,606 | $24,276 | $4,718 | $19,558 |
| 2021 | $2,557 | $22,229 | $4,102 | $18,127 |
| 2020 | $2,176 | $18,642 | $3,725 | $14,917 |
| 2019 | $2,205 | $18,883 | $3,108 | $15,775 |
| 2018 | $1,767 | $16,284 | $2,791 | $13,493 |
| 2017 | $1,864 | $15,628 | $2,791 | $12,837 |
| 2016 | $1,719 | $14,214 | $2,791 | $11,423 |
| 2015 | $1,622 | $14,053 | $2,791 | $11,262 |
| 2013 | -- | $13,225 | $2,791 | $10,434 |
Source: Public Records
Map
Nearby Homes
- 12508 W 56th St
- 12809 W 57th Terrace
- 5620 Monrovia St
- 5504 Monrovia St
- 5807 Noland Rd
- 5845 Caenen St
- 5507 Noland Rd
- 5407 Halsey St
- 13130 W 52nd Terrace
- 13126 W 52nd Terrace
- 13134 W 52nd Terrace
- 11815 W 53rd St
- 5919 Pflumm Rd
- 4908 Noland Rd
- 13305 W 51st St
- 5300 Summit Ct
- 5021 Bradshaw St
- 5703 Cottonwood St
- 5530 Rene St
- 5013 Bradshaw St
- 5639 Rosehill Rd
- 5631 Rosehill Rd
- 5643 Rosehill Rd
- 12618 W 57th St
- 5623 Rosehill Rd
- 12614 W 57th St
- 5610 Westgate St
- 5608 Westgate St
- 5612 Westgate St
- 12623 W 57th St
- 5604 Westgate St
- 12619 W 57th St
- 12602 W 57th St
- 5541 Rosehill Rd
- 12615 W 57th St
- 5600 Westgate St
- 5546 Rosehill Rd
- 12607 W 57th St
- 5532 Westgate St
- 12601 W 57th St