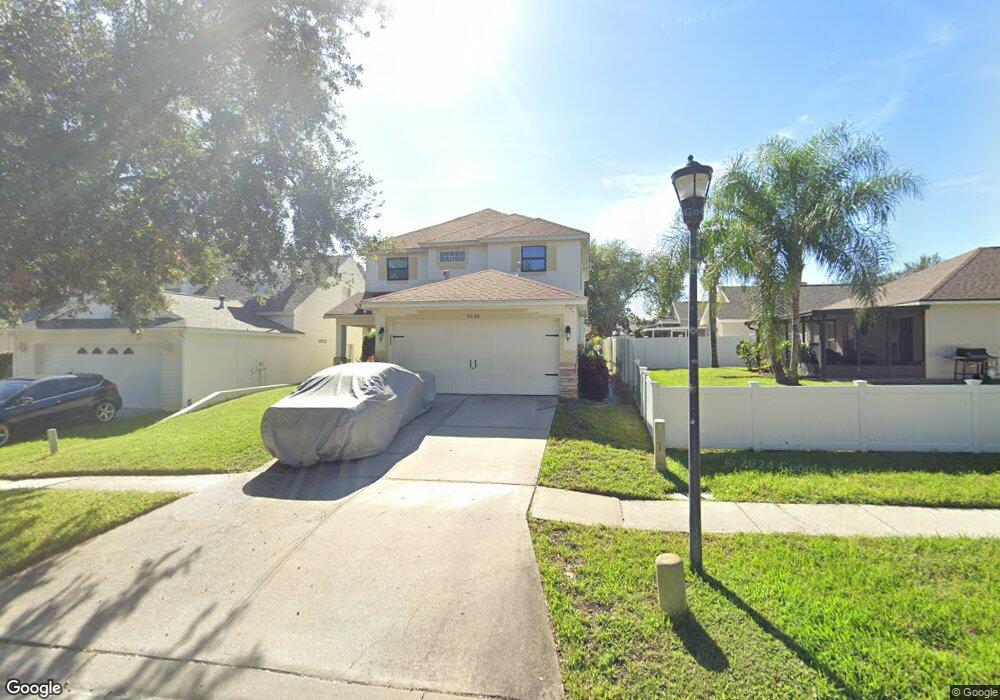
5638 Tanagergrove Way Unit 2 Lithia, FL 33547
FishHawk Ranch NeighborhoodEstimated Value: $364,000 - $444,000
3
Beds
3
Baths
1,805
Sq Ft
$222/Sq Ft
Est. Value
About This Home
This home is located at 5638 Tanagergrove Way Unit 2, Lithia, FL 33547 and is currently estimated at $401,149, approximately $222 per square foot. 5638 Tanagergrove Way Unit 2 is a home located in Hillsborough County with nearby schools including Bevis Elementary School, Randall Middle School, and Newsome High School.
Ownership History
Date
Name
Owned For
Owner Type
Purchase Details
Closed on
Sep 1, 2016
Sold by
Miller Debra Ann and Ortega Debra Ann
Bought by
Stanzas Adir and Stanzas Shirley Eitan
Current Estimated Value
Home Financials for this Owner
Home Financials are based on the most recent Mortgage that was taken out on this home.
Original Mortgage
$131,450
Outstanding Balance
$60,899
Interest Rate
3.48%
Mortgage Type
New Conventional
Estimated Equity
$340,250
Purchase Details
Closed on
Apr 20, 2012
Sold by
Ortega Debra Ann
Bought by
Ortega Debra Ann
Purchase Details
Closed on
Mar 15, 2011
Sold by
Ortega Debra Ann
Bought by
Ortega Debra Ann
Purchase Details
Closed on
Mar 31, 2003
Sold by
Cardel Master Builder Inc
Bought by
Ortega Debra A
Home Financials for this Owner
Home Financials are based on the most recent Mortgage that was taken out on this home.
Original Mortgage
$175,680
Interest Rate
5.74%
Create a Home Valuation Report for This Property
The Home Valuation Report is an in-depth analysis detailing your home's value as well as a comparison with similar homes in the area
Home Values in the Area
Average Home Value in this Area
Purchase History
| Date | Buyer | Sale Price | Title Company |
|---|---|---|---|
| Stanzas Adir | $225,000 | Sunbelt Title Agency | |
| Ortega Debra Ann | -- | Title Source Inc | |
| Ortega Debra Ann | -- | Title Source Inc | |
| Ortega Debra Ann | -- | Attorney | |
| Ortega Debra A | $175,700 | First American Title Ins Co |
Source: Public Records
Mortgage History
| Date | Status | Borrower | Loan Amount |
|---|---|---|---|
| Open | Stanzas Adir | $131,450 | |
| Previous Owner | Ortega Debra A | $175,680 |
Source: Public Records
Tax History Compared to Growth
Tax History
| Year | Tax Paid | Tax Assessment Tax Assessment Total Assessment is a certain percentage of the fair market value that is determined by local assessors to be the total taxable value of land and additions on the property. | Land | Improvement |
|---|---|---|---|---|
| 2024 | $4,595 | $209,650 | -- | -- |
| 2023 | $4,465 | $203,544 | $0 | $0 |
| 2022 | $4,284 | $197,616 | $0 | $0 |
| 2021 | $4,312 | $191,860 | $0 | $0 |
| 2020 | $4,223 | $189,211 | $0 | $0 |
| 2019 | $4,120 | $184,957 | $36,487 | $148,470 |
| 2018 | $4,126 | $182,899 | $0 | $0 |
| 2017 | $5,164 | $178,053 | $0 | $0 |
| 2016 | $3,909 | $144,254 | $0 | $0 |
| 2015 | $3,943 | $143,251 | $0 | $0 |
| 2014 | $3,918 | $142,114 | $0 | $0 |
| 2013 | -- | $140,014 | $0 | $0 |
Source: Public Records
Map
Nearby Homes
- 5601 Tanagergrove Way
- 5803 Tanagerside Rd
- 5833 Meadowpark Place
- 5839 Meadowpark Place
- 5909 Sandhill Ridge Dr
- 5865 Meadowpark Place
- 15733 Phoebepark Ave
- 5864 Fishhawk Ridge Dr
- 5919 Phoebenest Dr
- 5842 Heronpark Place
- 15733 Fishhawk Falls Dr
- 6107 Ibispark Dr
- 5814 Heronpark Place
- 15942 Ternglade Dr
- 6044 Sandhill Ridge Dr
- 5717 Fishhawk Ridge Dr
- 15758 Fishhawk Falls Dr
- 5712 Fishhawk Ridge Dr
- 15024 Eaglepark Place Unit I
- 6031 Gannetdale Dr
- 5636 Tanagergrove Way
- 5702 Tanagerlake Rd
- 5704 Tanagerlake Rd
- 5706 Tanagerlake Rd
- 5634 Tanagergrove Way
- 5708 Tanagerlake Rd Unit 1
- 5625 Tanagergrove Way
- 5634 Tanagerlake Rd
- 5710 Tanagerlake Rd
- 5712 Tanagerlake Rd
- 5712 Tanagerlake Rd Unit 1
- 5623 Tanagergrove Way
- 5632 Tanagerlake Rd
- 5702 Tanagergrove Way
- 5621 Tanagergrove Way
- 5630 Tanagerlake Rd
- 5704 Tanagergrove Way
- 5714 Tanagerlake Rd
- 5707 Tanagerlake Rd
- 5701 Tanagergrove Way