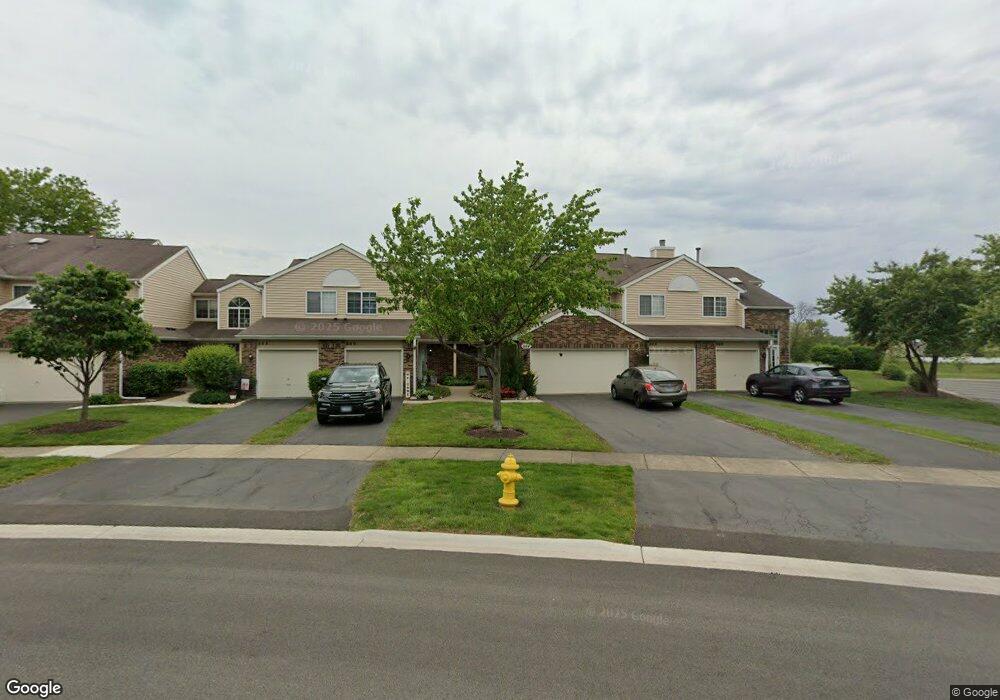
564 Canterbury Dr Unit 2D1 Carol Stream, IL 60188
Estimated Value: $295,000 - $332,342
3
Beds
3
Baths
1,528
Sq Ft
$206/Sq Ft
Est. Value
About This Home
This home is located at 564 Canterbury Dr Unit 2D1, Carol Stream, IL 60188 and is currently estimated at $314,586, approximately $205 per square foot. 564 Canterbury Dr Unit 2D1 is a home located in DuPage County with nearby schools including Cloverdale Elementary School, Stratford Middle School, and Glenbard North High School.
Ownership History
Date
Name
Owned For
Owner Type
Purchase Details
Closed on
Oct 16, 2017
Sold by
Ohannes Carrie A and Ohannes Lawrence P
Bought by
Khan Umer Maqsood
Current Estimated Value
Home Financials for this Owner
Home Financials are based on the most recent Mortgage that was taken out on this home.
Original Mortgage
$184,300
Outstanding Balance
$157,127
Interest Rate
4.62%
Mortgage Type
New Conventional
Estimated Equity
$157,459
Purchase Details
Closed on
Jul 26, 2002
Sold by
Ohannes Barbara J
Bought by
Barbara J Ohannes 2002 Declaration Trust
Purchase Details
Closed on
Jun 11, 1999
Sold by
Trevino Brigid
Bought by
Ohannes Barbara J
Home Financials for this Owner
Home Financials are based on the most recent Mortgage that was taken out on this home.
Original Mortgage
$56,000
Interest Rate
7.06%
Purchase Details
Closed on
May 30, 1997
Sold by
Trevino Brigid A
Bought by
American National Bk & Tr Co Of Chicago and Trust #500135-07
Create a Home Valuation Report for This Property
The Home Valuation Report is an in-depth analysis detailing your home's value as well as a comparison with similar homes in the area
Home Values in the Area
Average Home Value in this Area
Purchase History
| Date | Buyer | Sale Price | Title Company |
|---|---|---|---|
| Khan Umer Maqsood | $190,000 | Stewart Title | |
| Barbara J Ohannes 2002 Declaration Trust | -- | -- | |
| Ohannes Barbara J | $136,000 | -- | |
| Trevino Brigid | -- | -- | |
| American National Bk & Tr Co Of Chicago | -- | -- |
Source: Public Records
Mortgage History
| Date | Status | Borrower | Loan Amount |
|---|---|---|---|
| Open | Khan Umer Maqsood | $184,300 | |
| Previous Owner | Ohannes Barbara J | $56,000 |
Source: Public Records
Tax History Compared to Growth
Tax History
| Year | Tax Paid | Tax Assessment Tax Assessment Total Assessment is a certain percentage of the fair market value that is determined by local assessors to be the total taxable value of land and additions on the property. | Land | Improvement |
|---|---|---|---|---|
| 2024 | $7,128 | $91,088 | $16,982 | $74,106 |
| 2023 | $6,728 | $83,300 | $15,530 | $67,770 |
| 2022 | $6,227 | $73,500 | $13,700 | $59,800 |
| 2021 | $5,930 | $69,840 | $13,020 | $56,820 |
| 2020 | $5,828 | $68,130 | $12,700 | $55,430 |
| 2019 | $5,226 | $61,500 | $12,840 | $48,660 |
| 2018 | $4,927 | $59,030 | $12,320 | $46,710 |
| 2017 | $4,165 | $54,710 | $11,420 | $43,290 |
| 2016 | $3,888 | $50,630 | $10,570 | $40,060 |
| 2015 | $3,745 | $47,240 | $9,860 | $37,380 |
| 2014 | $3,713 | $46,280 | $9,660 | $36,620 |
| 2013 | $3,761 | $47,860 | $9,990 | $37,870 |
Source: Public Records
Map
Nearby Homes
- 975 Merbach Ct
- 852 Napa St
- 911 Hampton Dr
- 607 Kingsbridge Dr
- 1065 Brighton Dr
- 641 Kingsbridge Dr
- 312 Dancing Water Ct
- 808 Trinity Ct
- 351 Juniper Ct
- 1119 Orangery Ct
- 969 Dearborn Cir
- 720 Hoover Dr Unit 124
- 3870 Windjammer Ln
- 1090 Maubert Ct
- 787 Daybreak Ln Unit 207
- 244 Klein Creek Ct Unit 3
- 342 Klein Creek Ct Unit 342A
- 125 W Elk Trail Unit 124
- 107 W Elk Trail Unit 106
- 129 W Elk Trail Unit 329
- 552 Canterbury Dr Unit 2B2
- 578 Canterbury Dr Unit 1A
- 1036 Bedford Dr Unit 5A2
- 560 Canterbury Dr Unit E1
- 1044 Bedford Dr Unit BE1
- 568 Canterbury Dr Unit 2B1
- 1068 Bedford Dr Unit 4C
- 1022 Bedford Dr
- 1018 Bedford Dr
- 548 Canterbury Dr Unit 3A
- 542 Canterbury Dr Unit 3
- 554 Canterbury Dr Unit 2A2
- 584 Canterbury Dr Unit 1C
- 556 Canterbury Dr Unit 2D2
- 580 Canterbury Dr Unit 1D
- 1058 Bedford Dr Unit 4A
- 1050 Bedford Dr Unit 5A1
- 566 Canterbury Dr Unit 2A1
- 544 Canterbury Dr Unit 3E
- 1048 Bedford Dr Unit 5D1