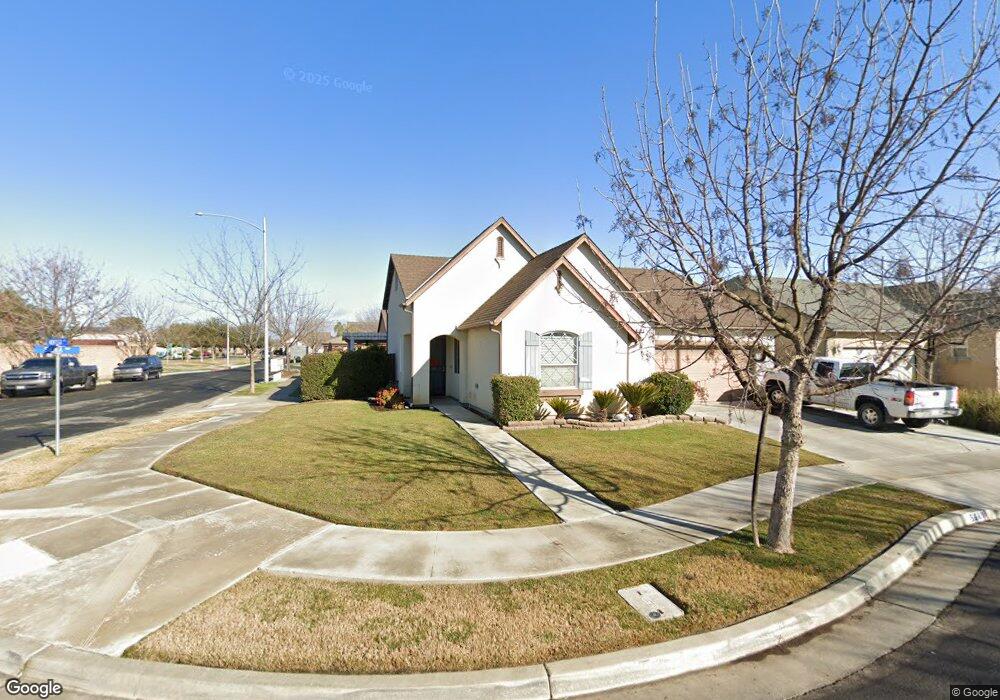
564 Siena Way Lemoore, CA 93245
Estimated Value: $354,564 - $383,000
3
Beds
2
Baths
1,451
Sq Ft
$255/Sq Ft
Est. Value
About This Home
This home is located at 564 Siena Way, Lemoore, CA 93245 and is currently estimated at $370,141, approximately $255 per square foot. 564 Siena Way is a home with nearby schools including Lemoore Elementary School, Liberty Middle School, and Lemoore High School.
Ownership History
Date
Name
Owned For
Owner Type
Purchase Details
Closed on
Jul 24, 2012
Sold by
Lemoore East Village 791 Lp
Bought by
Rico Gilbert and Rico Carolyn
Current Estimated Value
Home Financials for this Owner
Home Financials are based on the most recent Mortgage that was taken out on this home.
Original Mortgage
$190,474
Outstanding Balance
$130,230
Interest Rate
3.47%
Mortgage Type
VA
Estimated Equity
$239,911
Purchase Details
Closed on
Sep 7, 2011
Sold by
Shepherd Lane Lp
Bought by
Lemoore East Village 791 Lp
Purchase Details
Closed on
Dec 19, 2008
Sold by
Ic Lemoore Lp
Bought by
Fb Holdings Llc
Create a Home Valuation Report for This Property
The Home Valuation Report is an in-depth analysis detailing your home's value as well as a comparison with similar homes in the area
Home Values in the Area
Average Home Value in this Area
Purchase History
| Date | Buyer | Sale Price | Title Company |
|---|---|---|---|
| Rico Gilbert | $184,500 | None Available | |
| Lemoore East Village 791 Lp | -- | First American Title Company | |
| Fb Holdings Llc | $977,600 | None Available |
Source: Public Records
Mortgage History
| Date | Status | Borrower | Loan Amount |
|---|---|---|---|
| Open | Rico Gilbert | $190,474 |
Source: Public Records
Tax History
| Year | Tax Paid | Tax Assessment Tax Assessment Total Assessment is a certain percentage of the fair market value that is determined by local assessors to be the total taxable value of land and additions on the property. | Land | Improvement |
|---|---|---|---|---|
| 2025 | $2,852 | $227,059 | $80,040 | $147,019 |
| 2023 | $2,852 | $218,244 | $76,933 | $141,311 |
| 2022 | $2,966 | $213,966 | $75,425 | $138,541 |
| 2021 | $2,888 | $209,772 | $73,947 | $135,825 |
| 2020 | $2,813 | $207,621 | $73,189 | $134,432 |
| 2019 | $3,002 | $203,550 | $71,754 | $131,796 |
| 2018 | $2,878 | $199,559 | $70,347 | $129,212 |
| 2017 | $2,867 | $195,646 | $68,968 | $126,678 |
| 2016 | $2,879 | $191,810 | $67,616 | $124,194 |
| 2015 | $2,870 | $188,928 | $66,600 | $122,328 |
| 2014 | $2,810 | $185,227 | $65,295 | $119,932 |
Source: Public Records
Map
Nearby Homes
Your Personal Tour Guide
Ask me questions while you tour the home.