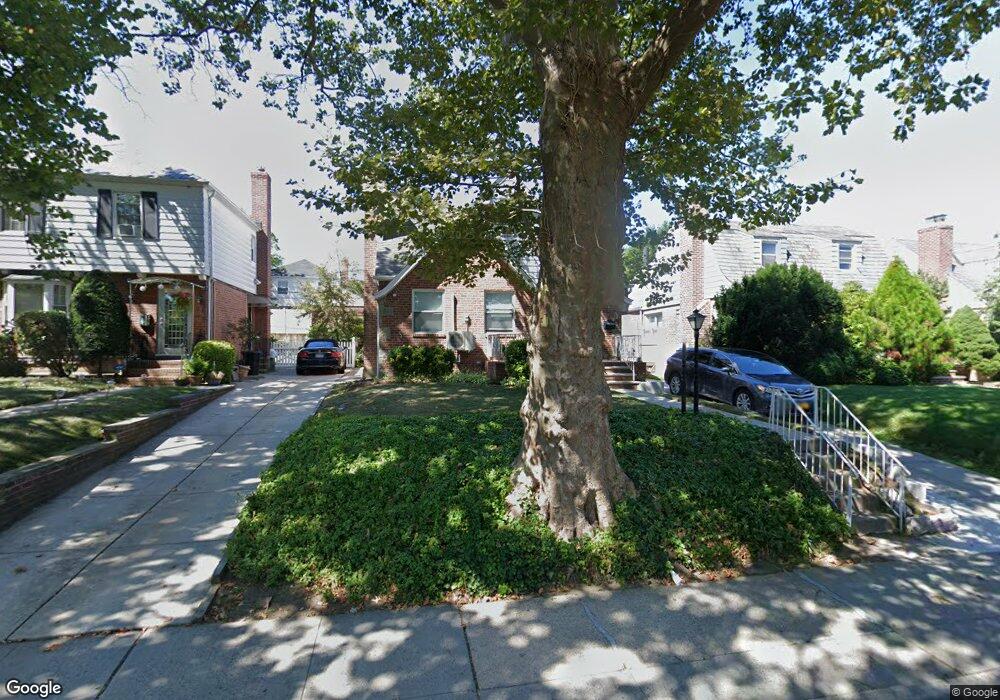
5642 Bell Blvd Flushing, NY 11364
Bayside NeighborhoodEstimated Value: $1,048,000 - $1,184,000
--
Bed
--
Bath
1,797
Sq Ft
$639/Sq Ft
Est. Value
About This Home
This home is located at 5642 Bell Blvd, Flushing, NY 11364 and is currently estimated at $1,147,542, approximately $638 per square foot. 5642 Bell Blvd is a home located in Queens County with nearby schools including P.S. 203 - Oakland Gardens, P.S. 376, and Nathaniel Hawthorne Middle School 74.
Ownership History
Date
Name
Owned For
Owner Type
Purchase Details
Closed on
Nov 4, 2020
Sold by
Brian G. Lockier As Executor
Bought by
Huang Wen Bin and Yu Cheng Wei
Current Estimated Value
Home Financials for this Owner
Home Financials are based on the most recent Mortgage that was taken out on this home.
Original Mortgage
$425,000
Outstanding Balance
$378,190
Interest Rate
2.8%
Mortgage Type
New Conventional
Estimated Equity
$769,352
Create a Home Valuation Report for This Property
The Home Valuation Report is an in-depth analysis detailing your home's value as well as a comparison with similar homes in the area
Home Values in the Area
Average Home Value in this Area
Purchase History
| Date | Buyer | Sale Price | Title Company |
|---|---|---|---|
| Huang Wen Bin | $850,000 | -- |
Source: Public Records
Mortgage History
| Date | Status | Borrower | Loan Amount |
|---|---|---|---|
| Open | Huang Wen Bin | $425,000 |
Source: Public Records
Tax History Compared to Growth
Tax History
| Year | Tax Paid | Tax Assessment Tax Assessment Total Assessment is a certain percentage of the fair market value that is determined by local assessors to be the total taxable value of land and additions on the property. | Land | Improvement |
|---|---|---|---|---|
| 2025 | $10,881 | $55,180 | $12,038 | $43,142 |
| 2024 | $10,881 | $54,174 | $12,425 | $41,749 |
| 2023 | $10,277 | $51,166 | $11,353 | $39,813 |
| 2022 | $9,699 | $64,440 | $17,160 | $47,280 |
| 2021 | $9,681 | $66,600 | $17,160 | $49,440 |
| 2020 | $3,903 | $65,160 | $17,160 | $48,000 |
| 2019 | $3,745 | $68,520 | $17,160 | $51,360 |
| 2018 | $3,393 | $42,638 | $11,260 | $31,378 |
| 2017 | $7,255 | $40,488 | $12,075 | $28,413 |
| 2016 | $6,692 | $40,488 | $12,075 | $28,413 |
| 2015 | $3,963 | $38,319 | $14,646 | $23,673 |
| 2014 | $3,963 | $37,621 | $16,343 | $21,278 |
Source: Public Records
Map
Nearby Homes