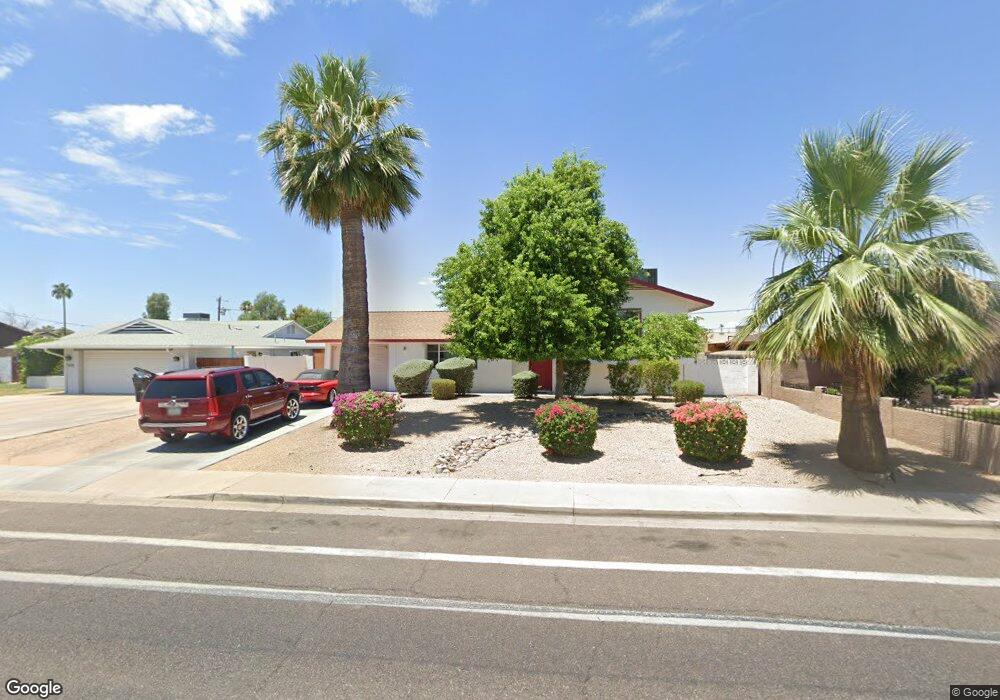
5642 N 39th Ave Phoenix, AZ 85019
Alhambra NeighborhoodEstimated Value: $338,178 - $397,000
4
Beds
2
Baths
1,590
Sq Ft
$231/Sq Ft
Est. Value
About This Home
This home is located at 5642 N 39th Ave, Phoenix, AZ 85019 and is currently estimated at $367,295, approximately $231 per square foot. 5642 N 39th Ave is a home located in Maricopa County with nearby schools including Sevilla Elementary School East, Sevilla Elementary School West, and Alhambra High School.
Ownership History
Date
Name
Owned For
Owner Type
Purchase Details
Closed on
May 13, 2021
Sold by
Barrad Brett
Bought by
Barrad Brett
Current Estimated Value
Home Financials for this Owner
Home Financials are based on the most recent Mortgage that was taken out on this home.
Original Mortgage
$247,500
Outstanding Balance
$224,297
Interest Rate
3.1%
Mortgage Type
New Conventional
Estimated Equity
$142,998
Purchase Details
Closed on
Jun 11, 2014
Sold by
Gamble Shirley A
Bought by
Wang Lan
Create a Home Valuation Report for This Property
The Home Valuation Report is an in-depth analysis detailing your home's value as well as a comparison with similar homes in the area
Home Values in the Area
Average Home Value in this Area
Purchase History
| Date | Buyer | Sale Price | Title Company |
|---|---|---|---|
| Barrad Brett | -- | Security Title Agency Inc | |
| Dopp Kathleen | $275,000 | Security Title Agency Inc | |
| Wang Lan | $101,100 | None Available |
Source: Public Records
Mortgage History
| Date | Status | Borrower | Loan Amount |
|---|---|---|---|
| Open | Barrad Brett | $247,500 |
Source: Public Records
Tax History Compared to Growth
Tax History
| Year | Tax Paid | Tax Assessment Tax Assessment Total Assessment is a certain percentage of the fair market value that is determined by local assessors to be the total taxable value of land and additions on the property. | Land | Improvement |
|---|---|---|---|---|
| 2025 | $1,046 | $7,281 | -- | -- |
| 2024 | $1,051 | $6,934 | -- | -- |
| 2023 | $1,051 | $24,730 | $4,940 | $19,790 |
| 2022 | $1,035 | $18,550 | $3,710 | $14,840 |
| 2021 | $1,044 | $16,860 | $3,370 | $13,490 |
| 2020 | $1,004 | $15,410 | $3,080 | $12,330 |
| 2019 | $992 | $13,760 | $2,750 | $11,010 |
| 2018 | $916 | $12,700 | $2,540 | $10,160 |
| 2017 | $904 | $10,080 | $2,010 | $8,070 |
| 2016 | $866 | $8,650 | $1,730 | $6,920 |
| 2015 | $820 | $7,280 | $1,450 | $5,830 |
Source: Public Records
Map
Nearby Homes
- 5654 N 39th Ave
- 5657 N 39th Ave
- 5634 N 39th Ave
- 3851 W Solano Dr
- 5632 N 38th Dr
- 5610 N 38th Dr Unit 3
- 3803 W San Miguel Ave
- 4019 W San Miguel Ave
- 4010 W Solano Dr N
- 5524 N 39th Ave
- 3746 W Luke Ave
- 5602 N 41st Ave
- 3705 W Luke Ave
- 3746 W Vermont Ave
- 4210 W Montebello Ave
- 3617 W Luke Ave
- 3601 W San Juan Ave
- 3618 W Rancho Dr
- 4033 W Berridge Ln
- 4026 W Berridge Ln
- 5648 N 39th Ave
- 5641 N 39th Dr
- 5633 N 39th Dr
- 5647 N 39th Dr
- 5628 N 39th Ave
- 5643 N 39th Ave
- 5647 N 39th Ave
- 5637 N 39th Ave
- 5653 N 39th Dr
- 5627 N 39th Dr
- 5653 N 39th Ave
- 5633 N 39th Ave
- 5658 N 39th Ave
- 3902 W San Juan Ave
- 5657 N 39th Dr
- 3926 W San Miguel Ave
- 5627 N 39th Ave
- 5644 N 38th Dr
- 3908 W San Juan Ave
- 5640 N 38th Dr