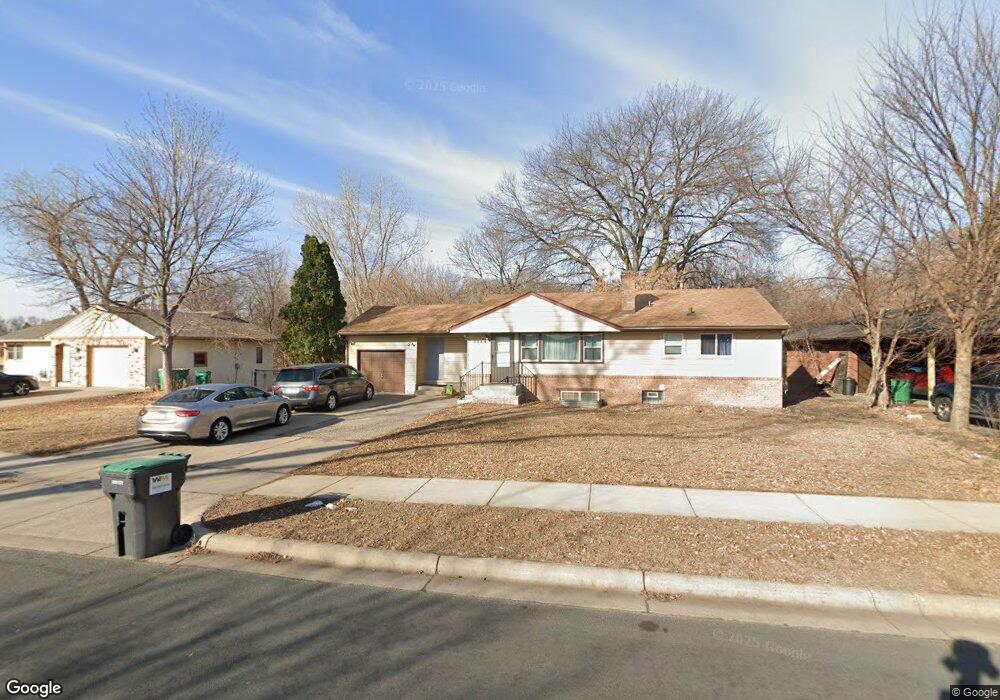
5643 Northport Dr Minneapolis, MN 55429
Twin Lake NeighborhoodEstimated Value: $309,000 - $363,643
3
Beds
2
Baths
1,000
Sq Ft
$336/Sq Ft
Est. Value
About This Home
This home is located at 5643 Northport Dr, Minneapolis, MN 55429 and is currently estimated at $336,411, approximately $336 per square foot. 5643 Northport Dr is a home located in Hennepin County with nearby schools including Northport Elementary School, Robbinsdale Middle School, and Robbinsdale Cooper Senior High School.
Ownership History
Date
Name
Owned For
Owner Type
Purchase Details
Closed on
Jan 17, 2023
Sold by
Moturi Mary M and Moturi Lamech
Bought by
Oghenekaro Enite E
Current Estimated Value
Home Financials for this Owner
Home Financials are based on the most recent Mortgage that was taken out on this home.
Original Mortgage
$224,000
Outstanding Balance
$216,699
Interest Rate
6.31%
Mortgage Type
New Conventional
Estimated Equity
$119,712
Purchase Details
Closed on
Jun 24, 2009
Sold by
Us Bank Na
Bought by
Motur Mary M
Purchase Details
Closed on
Jun 8, 2005
Sold by
Meh Thomas W and Massango Beatrice N
Bought by
Tchokouani Margaret
Purchase Details
Closed on
Mar 27, 2001
Sold by
Clauson Joseph W
Bought by
Meh Thomas W and Massango Beatrice N
Purchase Details
Closed on
Feb 28, 1996
Sold by
Stempfley Carole
Bought by
Clauson Joseph W
Create a Home Valuation Report for This Property
The Home Valuation Report is an in-depth analysis detailing your home's value as well as a comparison with similar homes in the area
Home Values in the Area
Average Home Value in this Area
Purchase History
| Date | Buyer | Sale Price | Title Company |
|---|---|---|---|
| Oghenekaro Enite E | $320,000 | -- | |
| Motur Mary M | $67,000 | -- | |
| Tchokouani Margaret | $195,000 | -- | |
| Meh Thomas W | $136,000 | -- | |
| Clauson Joseph W | $75,000 | -- |
Source: Public Records
Mortgage History
| Date | Status | Borrower | Loan Amount |
|---|---|---|---|
| Open | Oghenekaro Enite E | $224,000 |
Source: Public Records
Tax History Compared to Growth
Tax History
| Year | Tax Paid | Tax Assessment Tax Assessment Total Assessment is a certain percentage of the fair market value that is determined by local assessors to be the total taxable value of land and additions on the property. | Land | Improvement |
|---|---|---|---|---|
| 2024 | $4,291 | $279,600 | $107,000 | $172,600 |
| 2023 | $3,570 | $256,100 | $82,000 | $174,100 |
| 2022 | $3,035 | $248,000 | $81,000 | $167,000 |
| 2021 | $2,743 | $215,000 | $71,000 | $144,000 |
| 2020 | $3,264 | $186,000 | $50,000 | $136,000 |
| 2019 | $3,658 | $184,000 | $50,000 | $134,000 |
| 2018 | $3,334 | $193,000 | $51,000 | $142,000 |
| 2017 | $2,916 | $150,000 | $38,000 | $112,000 |
| 2016 | $3,021 | $148,300 | $41,600 | $106,700 |
| 2015 | $2,737 | $133,700 | $37,300 | $96,400 |
| 2014 | -- | $116,900 | $35,700 | $81,200 |
Source: Public Records
Map
Nearby Homes
- 5809 Pearson Dr
- 5808 Pearson Dr
- 3917 Eckberg Dr
- 5337 Sailor Ln
- 5427 Twin Lake Blvd E
- 5932 Admiral Ln N
- 5913 Zenith Ave N
- 5300 France Ave N
- 6019 Zenith Ave N
- 5261 Twin Lake Blvd E
- 5218 France Ave N
- 5217 Greatview Ave
- 5244 Vincent Ave N
- 4710 58th Ave N Unit 208
- 4710 58th Ave N Unit 219
- 4710 58th Ave N Unit 221
- 4710 58th Ave N Unit 319
- 4710 58th Ave N Unit 301
- 5253 Queen Ave N
- 2212 55th Ave N
- 5649 Northport Dr
- 5637 Northport Dr
- 5648 Northport Dr
- 5642 Northport Dr
- 5654 Northport Dr
- 5661 Northport Dr
- 5637 Brooklyn Blvd
- 5700 Northport Dr
- 3501 Admiral Ln N
- 5649 Brooklyn Blvd
- 5643 Brooklyn Blvd
- 5655 Brooklyn Blvd
- 3509 Admiral Ln N
- 5706 Northport Dr
- 5701 Brooklyn Blvd
- 3601 Admiral Ln N
- 3500 Admiral Ln N
- 5709 Brooklyn Blvd
- 3605 Admiral Ln N
- 3508 Admiral Ln N