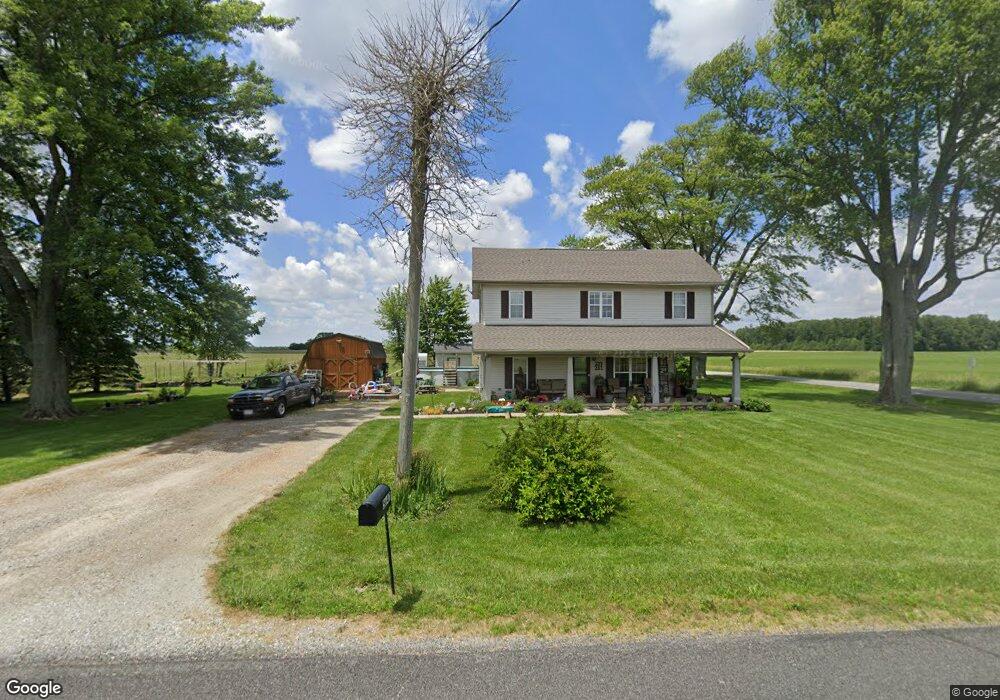
5647 Logan Shelby Rd Sidney, OH 45365
Estimated Value: $137,000 - $199,000
4
Beds
2
Baths
1,608
Sq Ft
$100/Sq Ft
Est. Value
About This Home
This home is located at 5647 Logan Shelby Rd, Sidney, OH 45365 and is currently estimated at $161,333, approximately $100 per square foot. 5647 Logan Shelby Rd is a home with nearby schools including Fairlawn Elementary School and Fairlawn High School.
Ownership History
Date
Name
Owned For
Owner Type
Purchase Details
Closed on
Sep 26, 2001
Sold by
Gardner Dustin A
Bought by
Marmon John F
Current Estimated Value
Home Financials for this Owner
Home Financials are based on the most recent Mortgage that was taken out on this home.
Original Mortgage
$104,550
Outstanding Balance
$41,164
Interest Rate
6.97%
Mortgage Type
New Conventional
Estimated Equity
$120,169
Purchase Details
Closed on
Aug 20, 1999
Sold by
Hildebrandt Ernst
Bought by
Gardner Dustin A and Gardner Patricia A
Home Financials for this Owner
Home Financials are based on the most recent Mortgage that was taken out on this home.
Original Mortgage
$98,900
Interest Rate
7.7%
Mortgage Type
VA
Purchase Details
Closed on
Oct 31, 1995
Sold by
Davis Lloyd E
Bought by
Ernest and Hildebrandt Charlotte A
Home Financials for this Owner
Home Financials are based on the most recent Mortgage that was taken out on this home.
Original Mortgage
$35,000
Interest Rate
9.5%
Mortgage Type
New Conventional
Create a Home Valuation Report for This Property
The Home Valuation Report is an in-depth analysis detailing your home's value as well as a comparison with similar homes in the area
Home Values in the Area
Average Home Value in this Area
Purchase History
| Date | Buyer | Sale Price | Title Company |
|---|---|---|---|
| Marmon John F | $124,700 | -- | |
| Gardner Dustin A | $97,000 | -- | |
| Ernest | $30,500 | -- |
Source: Public Records
Mortgage History
| Date | Status | Borrower | Loan Amount |
|---|---|---|---|
| Open | Marmon John F | $104,550 | |
| Previous Owner | Gardner Dustin A | $98,900 | |
| Previous Owner | Ernest | $35,000 |
Source: Public Records
Tax History Compared to Growth
Tax History
| Year | Tax Paid | Tax Assessment Tax Assessment Total Assessment is a certain percentage of the fair market value that is determined by local assessors to be the total taxable value of land and additions on the property. | Land | Improvement |
|---|---|---|---|---|
| 2024 | $1,327 | $38,730 | $8,740 | $29,990 |
| 2023 | $1,264 | $38,730 | $8,740 | $29,990 |
| 2022 | $1,218 | $30,310 | $7,100 | $23,210 |
| 2021 | $1,231 | $30,310 | $7,100 | $23,210 |
| 2020 | $1,170 | $30,310 | $7,100 | $23,210 |
| 2019 | $921 | $25,040 | $5,900 | $19,140 |
| 2018 | $896 | $25,040 | $5,900 | $19,140 |
| 2017 | $907 | $25,040 | $5,900 | $19,140 |
| 2016 | $759 | $22,070 | $4,910 | $17,160 |
| 2015 | $757 | $22,070 | $4,910 | $17,160 |
| 2014 | $757 | $22,070 | $4,910 | $17,160 |
| 2013 | $858 | $21,250 | $4,910 | $16,340 |
Source: Public Records
Map
Nearby Homes
- 5114 Dormire Rd
- 21242 Dingman Slagle Rd
- 327 S Miami St
- 0 Dingman-Slagle Rd Unit 1856661
- 0 Dingman-Slagle Rd Unit 225034870
- 0 Dingman-Slagle Rd Unit 1039895
- 10879 Archer St
- 9351 Crowl Rd
- 18255 Pence Rd
- 18333 Herring Rd
- 201 Canal St
- 116 N Mill St
- 103 N Boggs St
- 380 S Main St
- 341 S Main St
- 203 N Koke St
- 17261 Ohio 47
- 8154 Crowl Rd
- 1253 Gearhart Rd
- 1305 Constitution Ave