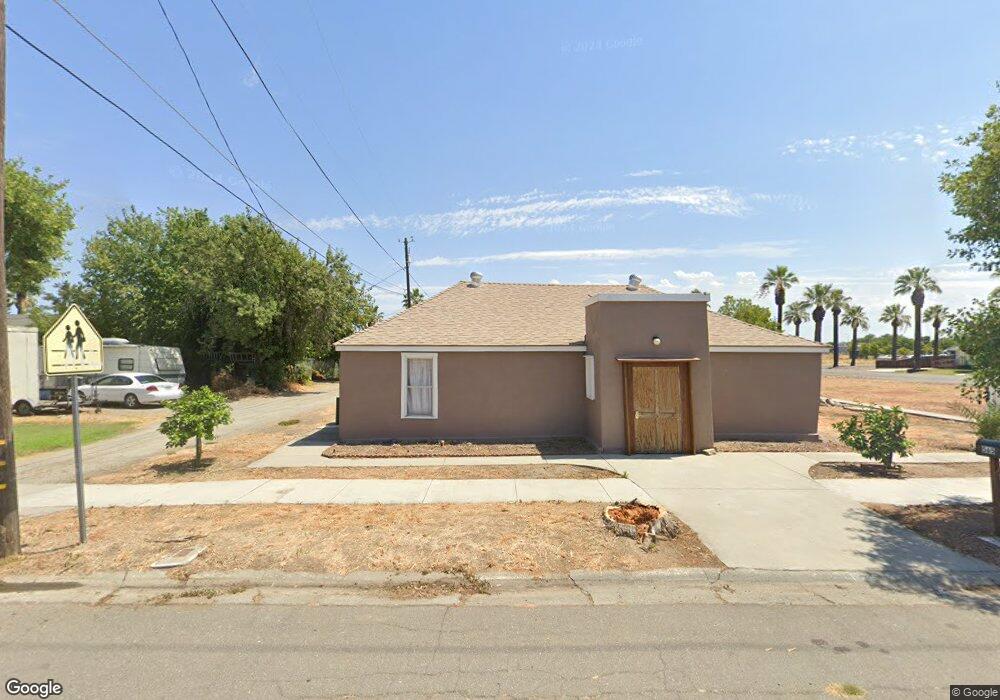
565 1st St Corning, CA 96021
Estimated Value: $245,379
2
Beds
2
Baths
2,600
Sq Ft
$94/Sq Ft
Est. Value
About This Home
This home is located at 565 1st St, Corning, CA 96021 and is currently estimated at $245,379, approximately $94 per square foot. 565 1st St is a home located in Tehama County with nearby schools including Olive View Elementary School, Maywood Middle School, and Corning High School.
Ownership History
Date
Name
Owned For
Owner Type
Purchase Details
Closed on
Feb 24, 2021
Sold by
Abundiz Mendoza Ociel
Bought by
Gm Real Estate Investments Llc
Current Estimated Value
Purchase Details
Closed on
Jan 5, 2015
Sold by
Lince Maria
Bought by
Lince Christobal
Purchase Details
Closed on
Oct 17, 2014
Sold by
The California Association Of Regular Ba
Bought by
Sierra Butte Baptist Association
Create a Home Valuation Report for This Property
The Home Valuation Report is an in-depth analysis detailing your home's value as well as a comparison with similar homes in the area
Purchase History
| Date | Buyer | Sale Price | Title Company |
|---|---|---|---|
| Gm Real Estate Investments Llc | $215,000 | Northern California Title Co | |
| Lince Christobal | -- | Northern California Title Co | |
| Lince Cristobal | $70,000 | Northern California Title Co | |
| Sierra Butte Baptist Association | -- | Northern California Title Co |
Source: Public Records
Tax History
| Year | Tax Paid | Tax Assessment Tax Assessment Total Assessment is a certain percentage of the fair market value that is determined by local assessors to be the total taxable value of land and additions on the property. | Land | Improvement |
|---|---|---|---|---|
| 2025 | $2,727 | $264,557 | $64,945 | $199,612 |
| 2023 | $2,676 | $254,286 | $62,424 | $191,862 |
| 2022 | $2,322 | $219,300 | $61,200 | $158,100 |
| 2021 | $784 | $75,000 | $35,000 | $40,000 |
| 2020 | $821 | $76,922 | $32,966 | $43,956 |
| 2019 | $788 | $75,415 | $32,320 | $43,095 |
| 2018 | $789 | $73,937 | $31,687 | $42,250 |
| 2017 | $784 | $72,488 | $31,066 | $41,422 |
| 2016 | $731 | $71,067 | $30,457 | $40,610 |
| 2015 | $262 | $24,818 | $8,619 | $16,199 |
| 2014 | -- | $34,451 | $8,451 | $26,000 |
Source: Public Records
Map
Nearby Homes
Your Personal Tour Guide
Ask me questions while you tour the home.