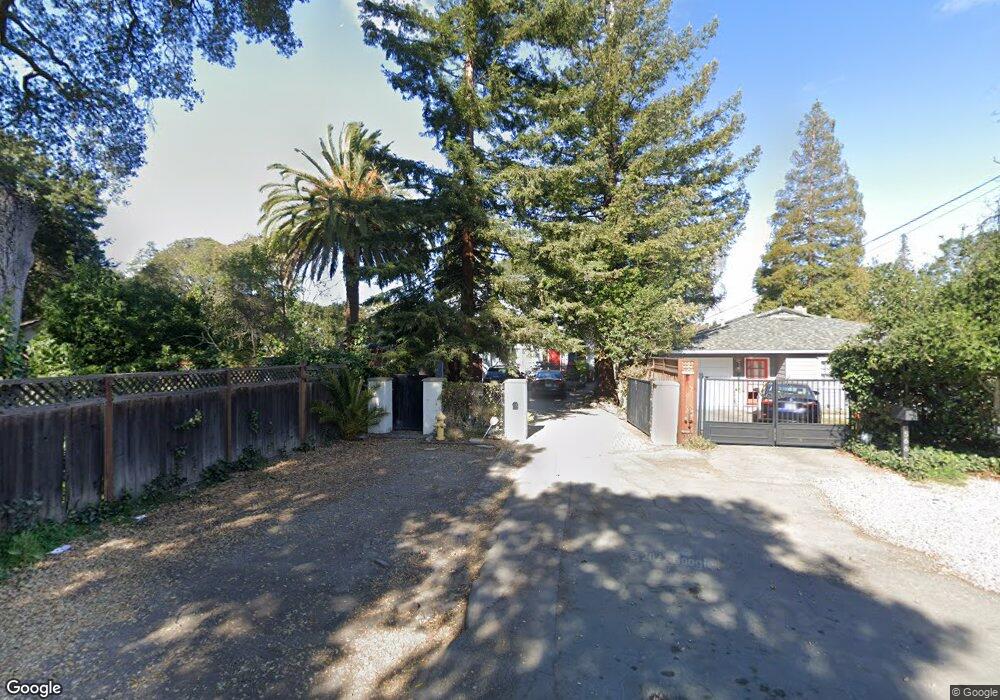
565 Encina Ave Menlo Park, CA 94025
North Fair Oaks NeighborhoodEstimated Value: $2,724,000 - $3,426,000
3
Beds
3
Baths
3,057
Sq Ft
$1,011/Sq Ft
Est. Value
About This Home
This home is located at 565 Encina Ave, Menlo Park, CA 94025 and is currently estimated at $3,089,478, approximately $1,010 per square foot. 565 Encina Ave is a home located in San Mateo County with nearby schools including Garfield Elementary School, John F. Kennedy Middle School, and Menlo-Atherton High School.
Ownership History
Date
Name
Owned For
Owner Type
Purchase Details
Closed on
Apr 13, 2011
Sold by
Hamerton Kelly Robert and Hamerton Kelly Rosemary
Bought by
Shetty Prashanth and Shetty Subha
Current Estimated Value
Home Financials for this Owner
Home Financials are based on the most recent Mortgage that was taken out on this home.
Original Mortgage
$729,750
Outstanding Balance
$504,167
Interest Rate
4.83%
Mortgage Type
New Conventional
Estimated Equity
$2,585,311
Purchase Details
Closed on
May 30, 1997
Sold by
Alan Remmel Mark
Bought by
Hamerton Kelly Robert and Hamerton Kelly Rosemary
Home Financials for this Owner
Home Financials are based on the most recent Mortgage that was taken out on this home.
Original Mortgage
$447,400
Interest Rate
6.5%
Create a Home Valuation Report for This Property
The Home Valuation Report is an in-depth analysis detailing your home's value as well as a comparison with similar homes in the area
Home Values in the Area
Average Home Value in this Area
Purchase History
| Date | Buyer | Sale Price | Title Company |
|---|---|---|---|
| Shetty Prashanth | $1,075,000 | First American Title Company | |
| Hamerton Kelly Robert | $6,180,000 | North American Title Insuran |
Source: Public Records
Mortgage History
| Date | Status | Borrower | Loan Amount |
|---|---|---|---|
| Open | Shetty Prashanth | $729,750 | |
| Previous Owner | Hamerton Kelly Robert | $447,400 |
Source: Public Records
Tax History Compared to Growth
Tax History
| Year | Tax Paid | Tax Assessment Tax Assessment Total Assessment is a certain percentage of the fair market value that is determined by local assessors to be the total taxable value of land and additions on the property. | Land | Improvement |
|---|---|---|---|---|
| 2025 | $16,536 | $1,377,252 | $688,626 | $688,626 |
| 2023 | $16,536 | $1,323,774 | $661,887 | $661,887 |
| 2022 | $15,470 | $1,297,818 | $648,909 | $648,909 |
| 2021 | $15,302 | $1,272,372 | $636,186 | $636,186 |
| 2020 | $15,085 | $1,259,326 | $629,663 | $629,663 |
| 2019 | $14,972 | $1,234,634 | $617,317 | $617,317 |
| 2018 | $14,509 | $1,210,426 | $605,213 | $605,213 |
| 2017 | $14,175 | $1,186,694 | $593,347 | $593,347 |
| 2016 | $13,888 | $1,163,426 | $581,713 | $581,713 |
| 2015 | $13,365 | $1,145,952 | $572,976 | $572,976 |
| 2014 | $13,094 | $1,123,506 | $561,753 | $561,753 |
Source: Public Records
Map
Nearby Homes