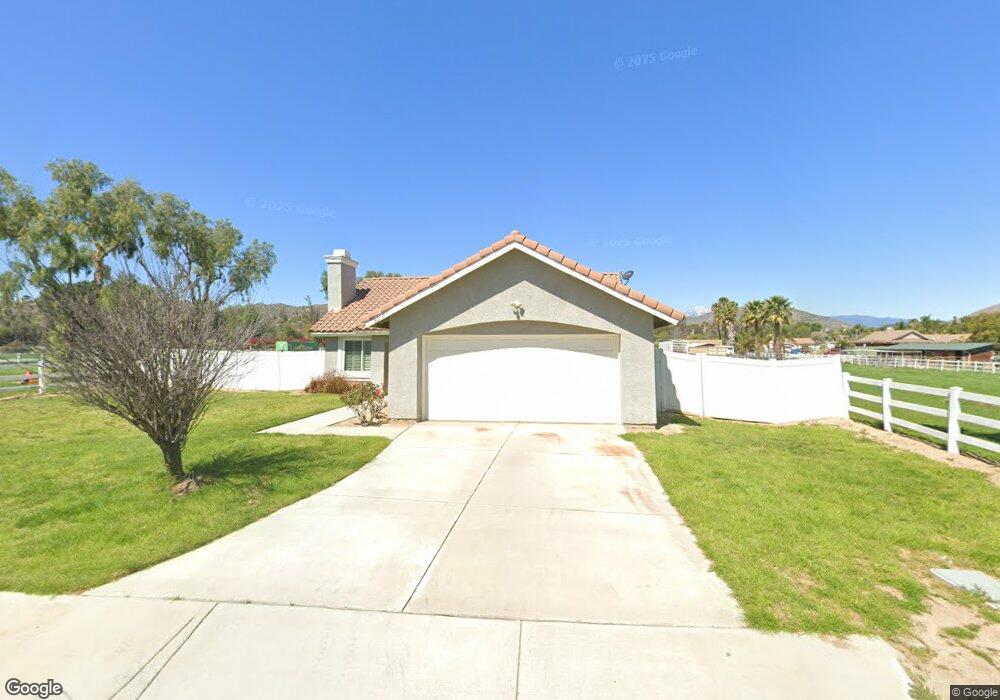
5650 Jensen Ranch Rd Riverside, CA 92509
Rubidoux NeighborhoodEstimated Value: $655,000 - $731,000
4
Beds
2
Baths
1,401
Sq Ft
$493/Sq Ft
Est. Value
About This Home
This home is located at 5650 Jensen Ranch Rd, Riverside, CA 92509 and is currently estimated at $690,407, approximately $492 per square foot. 5650 Jensen Ranch Rd is a home located in Riverside County with nearby schools including Peralta Elementary, Mission Middle School, and Rubidoux High School.
Ownership History
Date
Name
Owned For
Owner Type
Purchase Details
Closed on
Jun 14, 2012
Sold by
Bonner John A
Bought by
Bonner John A
Current Estimated Value
Home Financials for this Owner
Home Financials are based on the most recent Mortgage that was taken out on this home.
Original Mortgage
$248,550
Outstanding Balance
$171,768
Interest Rate
3.77%
Mortgage Type
New Conventional
Estimated Equity
$518,639
Purchase Details
Closed on
Apr 23, 2010
Sold by
Bonner John A
Bought by
Bonner John A
Purchase Details
Closed on
Nov 4, 2009
Sold by
Bonner Helen M
Bought by
Bonner John A
Purchase Details
Closed on
Mar 27, 2002
Sold by
Ror Equestrian 10
Bought by
Bonner John A and Bonner Helen M
Home Financials for this Owner
Home Financials are based on the most recent Mortgage that was taken out on this home.
Original Mortgage
$231,992
Interest Rate
7.13%
Mortgage Type
Purchase Money Mortgage
Create a Home Valuation Report for This Property
The Home Valuation Report is an in-depth analysis detailing your home's value as well as a comparison with similar homes in the area
Home Values in the Area
Average Home Value in this Area
Purchase History
| Date | Buyer | Sale Price | Title Company |
|---|---|---|---|
| Bonner John A | -- | Accommodation | |
| Bonner John A | -- | First American Title Company | |
| Bonner John A | -- | None Available | |
| Bonner John A | -- | None Available | |
| Bonner John A | $290,000 | Orange Coast Title |
Source: Public Records
Mortgage History
| Date | Status | Borrower | Loan Amount |
|---|---|---|---|
| Open | Bonner John A | $248,550 | |
| Previous Owner | Bonner John A | $231,992 |
Source: Public Records
Tax History
| Year | Tax Paid | Tax Assessment Tax Assessment Total Assessment is a certain percentage of the fair market value that is determined by local assessors to be the total taxable value of land and additions on the property. | Land | Improvement |
|---|---|---|---|---|
| 2025 | $4,581 | $428,388 | $177,262 | $251,126 |
| 2023 | $4,581 | $411,755 | $170,380 | $241,375 |
| 2022 | $4,484 | $403,683 | $167,040 | $236,643 |
| 2021 | $4,458 | $395,768 | $163,765 | $232,003 |
| 2020 | $4,416 | $391,711 | $162,086 | $229,625 |
| 2019 | $4,326 | $384,031 | $158,908 | $225,123 |
| 2018 | $4,186 | $376,502 | $155,793 | $220,709 |
| 2017 | $4,141 | $369,121 | $152,739 | $216,382 |
| 2016 | $4,083 | $361,885 | $149,745 | $212,140 |
| 2015 | $4,027 | $356,451 | $147,497 | $208,954 |
| 2014 | $3,752 | $349,470 | $144,608 | $204,862 |
Source: Public Records
Map
Nearby Homes
- 4598 Plaza Ln
- 0 Plaza Ln
- 6000 Limonite Ave
- 5970 Sky Meadow St
- 5748 Tilton Ave
- 0 42nd St
- 5754 Tilton Ave
- 6057 Saddlehorn Ln
- Estrella - Plan 3 at Las Palmas
- Amada - Plan 2 at Las Palmas
- Plan 3 - Serenity at Countryside Estates
- Plan 1 - Alisal at Countryside Estates
- Plan 2 - Pinehurst at Countryside Estates
- 6056 Saddlehorn Ln
- 6079 Saddlehorn Ln
- 6088 Saddlehorn Ln
- 6568 Avenida Mariposa
- 5244 Holstein Way
- 3934 Pontiac Ave
- 4077 Riverview Dr
- 5670 Jensen Ranch Rd
- 5653 Jensen Ranch Rd
- 5641 Jensen Ranch Rd
- 5665 46th St
- 5700 Jensen Ranch Rd
- 5590 46th St
- 5666 46th St
- 5630 46th St
- 5677 Jensen Ranch Rd
- 5665 Jensen Ranch Rd
- 5689 Jensen Ranch Rd
- 5701 Jensen Ranch Rd
- 5580 46th St
- 5720 Jensen Ranch Rd
- 4478 Riverbend Ln
- 5713 Jensen Ranch Rd
- 4490 Riverbend Ln
- 4470 Riverbend Ln
- 4500 Riverbend Ln
- 5725 Jensen Ranch Rd
Your Personal Tour Guide
Ask me questions while you tour the home.